
There has been a paradigm shift in application development and operations that promises agility, increased innovation, and faster time-to-market. While Docker and Kubernetes are at the core of this shift, running the new stack reliably and securely requires much more – from security and governance to visibility into applications and infrastructure. What are all the pieces needed to run containerized applications and services at scale? Which technologies complement Kubernetes best?
A modern enterprise using container technology and Kubernetes has multiple software development infrastructure requirements, including additional stacks running alongside Kubernetes. While some needs overlap (e.g. security, reliability, performance, and portability), Developers and DevOps/Ops have different requirements during the application lifecycle (see graphic 1).
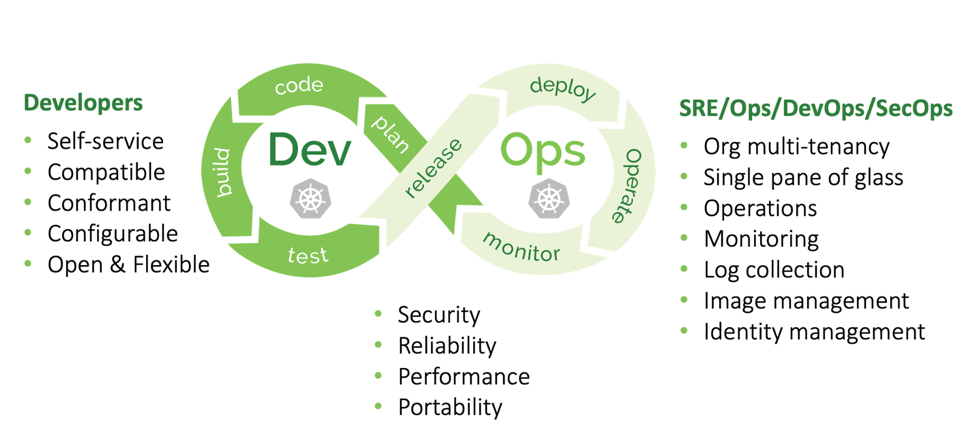
Graphic 1: Development vs operational Kubernetes enterprise requirements
Broadly speaking, developers seek to:
- Quickly deploy and tear clusters down for testing
- Release their build to any of the existing clusters, without the need to finetune or customize their work per-environment
- Use conformant open-source Kubernetes for all test, QA, stage, and production clusters, and avoid custom builds or forks of the upstream version, and modified Kubernetes components to ensure their software works equally on all cloud providers and on-premises clusters
- Configure relevant Kubernetes settings to better achieve their goals
Operations teams (DevOps/SRE/SecOps) are mainly concerned with:
- Organizational multi-tenancy, to allow simple and straightforward separation of identities and access rights to particular parts of the same cluster, or a group of clusters
- User-friendly dashboard that aggregates all key cluster insights and allows to backup and restore a cluster, manage credentials, scale out, and so on
- Easy to set up (centralized) monitoring and maintenance that avoids complexity and incompatibilities between cluster metric formats or versions
- Centralized log collection from all software components running in different clusters, including geo distributed clusters when applicable. Log aggregation and delivery must be reliable, cached on the edge clusters in case of inter-cluster network failures, and delivered to the centralized logging platform as soon as network connectivity is restored
- Not compromising enterprise-grade security and auditing for convenience or development agility
- Reliability and performance of the platform, self-healing, and self-reliance where possible
- Ease of use, minimized maintenance overhead, increased automation (including re-scaling and re-balancing workloads, revoke or rotate credentials, terminate and clean up temporary clusters, analyze and detect idle or underutilized resources, and mitigate recurring errors)
- Portability, in case of an urgent migration between datacenters, or clouds that require a conformant and modular platform
While these requirements can be reached through a variety of open source stacks and frameworks, there is no single source of truth available for teams to deal with their own priorities during the research process. A description of all possible tool and practices combinations to achieve the same goals may span hundreds of pages. Here is just a quick example of the various options for Kubernetes log collection tools used today:
The agent: logstash, collectord (for Splunk), fluent-bit, fluentd, filebeat
Collection mechanism: You could use a sidecar container in each pod. Nah, too heavy, as so many log collectors. Or maybe a single Daemon set with one collector per worker node that reads all logs from “/var/lib/docker” and flattens/relabels the messages? Should you flatten or modify log messages on the worker node (fluentd stream processing, logstash mutate) or in the central storage on arrival? Graylog pipelines or ES Ingest Node anyone? How about pushing the logs directly from the application to Elasticsearch, Splunk, or Graylog nodes? Or configuring the Docker logging driver to do it for us.
Storing and analyzing logs: There is Elasticsearch, Graylog, Splunk, Papertrail, Loggly, and much more. Some are self-hosted, others provide additional benefits like threat analysis (AlienVault / LogRhythm). And all are Kubernetes compatible allowing you to send logs to be analyzed and alert based on detected events and messages.
This is just one example and numerous combinations are possible. There are audit, metrics, deployment methods, and so on. All have multiple possible but also often incompatible solutions. Figuring out what works requires a lot of time, money, and serious expertise.
Incompatibility issues often arise during a merger or acquisition, when several departments combine their operations. To achieve the same goal, often completely different approaches are taken. A unified approach, at least across departments of the same company, could avoid a lot of future headaches. Unfortunately, such an approach doesn’t exist yet. There is no production-grade solution that unifies all aspects of software delivery and wraps it into a single box. Most vendors focus on a particular niche becoming yet another piece in the puzzle.
This isn’t unlike the situation we were in a few years after Docker’s first public release. Engineers used whatever tools they were familiar with to deploy and orchestrate Docker containers, starting from raw shell scripting and crontab schedules, to Ansible, Chef, Puppet, Docker-Compose, and self-written Python/Ruby/Java schedulers and health-checkers, that were supervising and managing a fleet of containers. The architecture of each project was a unique snowflake, increasing both, the maintenance overhead, and the onboarding learning curve for new team members (while it’s possible to hire talent with a particular skillset like “Helm charts for Kubernetes”, it is impossible to hire someone who knows the self-written tools. In-house training was inevitable).
This all changed with Kubernetes. An opinionated and structured framework that taught us what’s possible in a container world, how to do it right, and implemented all the features that a community could have dreamed of. It became the clear winner and the de-facto orchestrator for containerized workloads.
Centralized Control Plane for Multi-Cluster Operations
Over the past decade, our team worked on dozens of large-scale software projects across multiple environments, from single to multi-cloud, on-premise or hybrid. At some point, the need for a unified approach became clear. We’ll share our approach, and technologies used, and lessons learned.
While each organization has unique use cases, software development processes, and target environments (cloud, on-premises, hybrid), the delivery to all these environments can be unified. Required components such as role-based access control, audit, metrics logging and monitoring, easy to use deployment and update mechanisms, multi-cluster and multi-region scalability, are universal enterprise requirements and can be bundled into one approach across the organization.
What does it take to create a stable, production grade platform that configures components for best performance with a single pane of glass for multi-cluster, hybrid and multi-cloud topology? It is a long journey, and we’ll be sharing our secret sauce with you. It will be up to the reader to decide if they want to attempt it themselves or use a vendor supported platform such as Kublr.
Control Plane Architecture
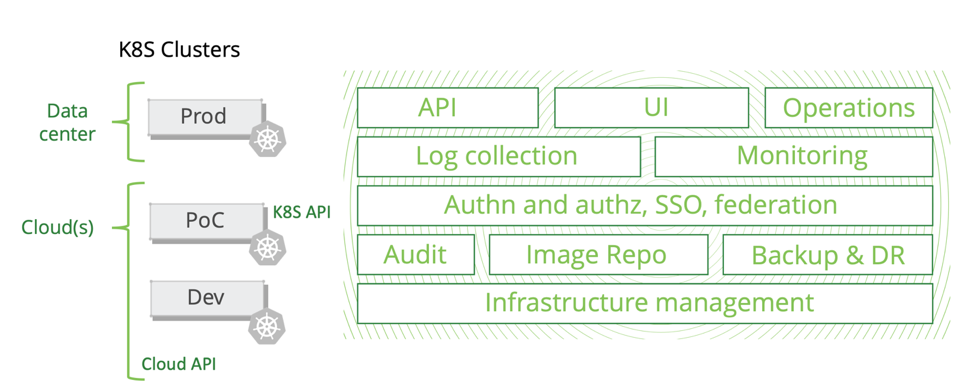
Graphic 2: Control Plane Architecture
A Kubernetes management control plane should span multiple infrastructure layers and connect all pieces into a tested and reliable platform that minimizes maintenance of large a number of Kubernetes clusters.
For self-sufficiency at a cluster level and to avoid strictly relying on control plane availability in real time, we deploy an agent alongside the “kubelet” and other core Kubernetes components. The agent, which communicates with external metadata storage named “Orchestration Store,” receives information about required actions to be performed on the cluster and its components. This automates numerous routine maintenance tasks, otherwise done by DevOps/SRE engineers. While it may not be noticeable in a small environment, it proves extremely valuable at scale.
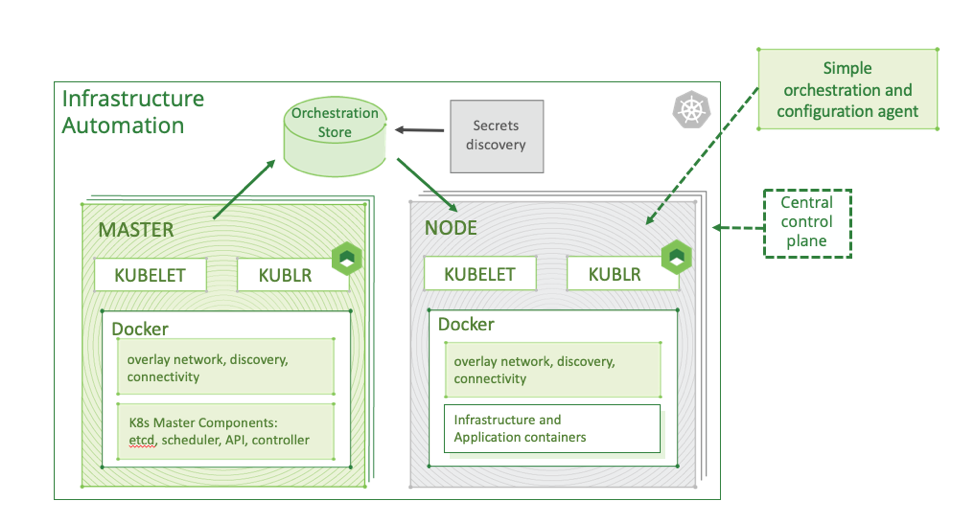
Graphic 3: Kubernetes cluster self-sufficiency
An active control plane should never be critical or mandatory for the health of the Kubernetes cluster—the state should be stored in a central location (e.g. any cloud storage like S3 or even a shared NFS partition). This will provide additional resiliency, in case the agent fails to reach the control plane directly.
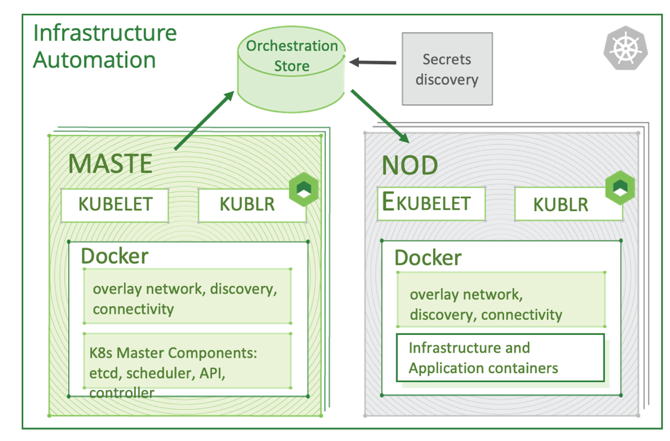
Graphic 4: Cluster portability
A modular architecture provides portability and environment independence (cloud or on-prem bound). The metadata store can be hosted anywhere, and the dockerized agent can run on any Linux distribution and hardware. Initial configuration requirements are minimal and can easily be deployed to a secure on-premise datacenter running VMware or OpenStack, or in a public cloud with the native deployment tools of each particular environment (CloudFormation, Azure ARM, Ansible, Chef, etc.). Portability protects you against vendor lock-in when deploying in the cloud. Ensure you are able to backup and restore the same cluster into any location provided they run Linux servers and Docker.
Centralizing the Log and Metrics Collection
While this may not be a key point of concern when you start out, it likely will once you expand your Kubernetes deployments and given the pace of Kubernetes adoption, an expansion is almost inevitable.
Enterprises that manage several clusters or a large multi-cloud infrastructure will want to aggregate logs into a central location. This facilitates event analysis and increases visibility into the overall state of your system. In the graphic below, you’ll see Kublr’s logging architecture which is deployed each time you create a new cluster with the control plane:
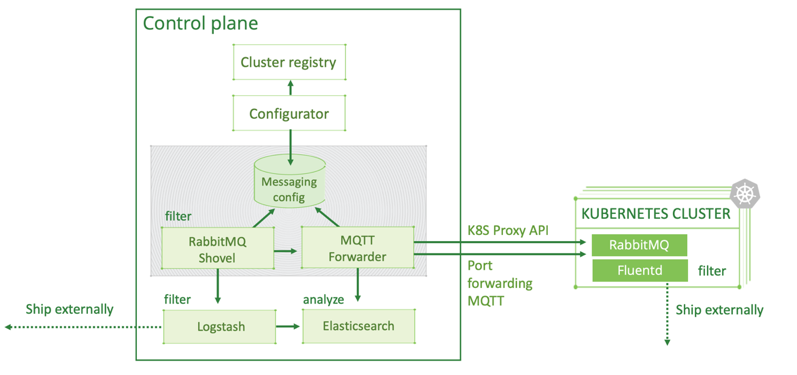
Graphic 5: Our Logging Architecture
The Kubernetes cluster contains a Fluentd agent for log collection. It sends log messages to a local RabbitMQ process to further deliver every log message in case of a network interruption between the edge cluster and the control plane. We use an MQTT Forwarder plugin to forward log messages from local queues into the centralized RabbitMQ (read this blog on reliable, fault-tolerant messaging with RabbitMQ). These log messages are then extracted with Logstash and written in the primary Elasticsearch cluster. Additional operations, performed during log forwarding and ingestion into the Elasticsearch cluster, are message structure flattening to reduce nested fields and field variation when not required.
This approach ensures that all Kubernetes component logs have the same structure and can be easily indexed and searched for. It also improves performance and reduces the need for compute power and storage size of the primary Elasticsearch cluster. The control plane’s Cluster Registry keeps configuration and state information about all edge clusters, generates a dynamic “messaging config” for them, controlling the entire multi-cluster logging infrastructure from a central location with an agent on each worker nodes. This ensures resilience to temporary network failures as the configuration will be applied eventually after network connectivity between clusters is restored.
We recommend a similar approach for metrics collection across all clusters to gain an aggregated view and analysis. This graphic shows cluster monitoring components, as usually set up for a single cluster. Kublr alters this architecture by moving the heaviest components into the centralized control plane.
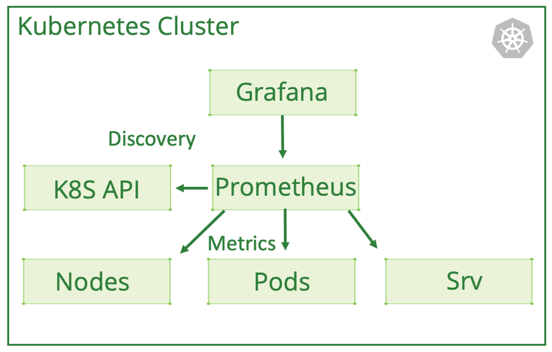
Graphic 6: Kubernetes Monitoring with Prometheus
A lightweight Prometheus with a short retention period is deployed into each cluster during the automatic bootstrap process. Through the master node’s API endpoint, it discovers all Kubernetes pods and components that can be monitored and automatically configures the metric collection intervals for all these targets. Metrics are collected internally through the overlay network inside the cluster without sending them over the internet (provided all worker nodes are in the same location). The retention period can be anything from 30 minutes to a few hours, ensuring we keep all real-time data on the edge cluster which is then federated to a centralized Prometheus.
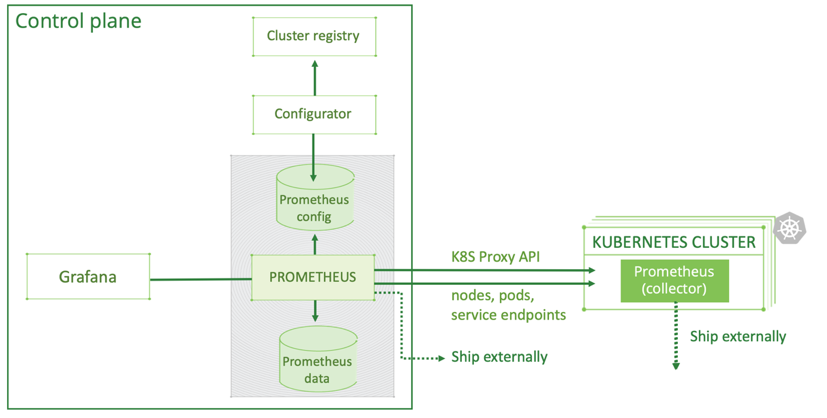
Graphic 7: Centralized Kubernetes monitoring with Prometheus
For long term storage and analytics, the primary Prometheus pulls logs from all clusters through a Kubernetes proxy. Metrics are relabeled so they include the cluster name. Grafana, a great visualization tool, uses a variable in all queries to represent a selected cluster. All dashboards, now cluster-aware, enable the user to filter by cluster. This approach provides visibility into all deployed software components across all clusters from a single pane of glass.
Additionally, we recommend you look into the following components: Keycloak, an identity broker that integrates with LDAP, Active Directory, SAML, and OAuth. Your organization may already have their own existing user stores and identity platforms. Keycloak enables you to use the tools you already have with your Kubernetes clusters.
There is much more to enterprise-grade container management than Docker and Kubernetes. While at the core of our approach, they are merely a part of a much larger puzzle. To reliably and securely run containerized application at scale, you need numerous other tools and, as we have seen, there are multiple options and possible combinations. The approach we have outlined is our answer to a bundled approach that works across an organization and scales. While complex to implement, it has proven to work. You can either develop it in-house or partner with the right vendor.