
Introducing Kublr-Managed Kubernetes
You don’t have to install and maintain a complex cluster to benefit from all of the Kubernetes features. Instead, you can have Kublr manage installation and maintenance.
In this tutorial, we’ll demonstrate how easy it is to deploy a highly available Kubernetes cluster on top of your existing AWS infrastructure.
To begin using Kublr, login to your account and specify the AWS credentials that the Kublr platform will use to create and manage the needed resources for the Kubernetes cluster.
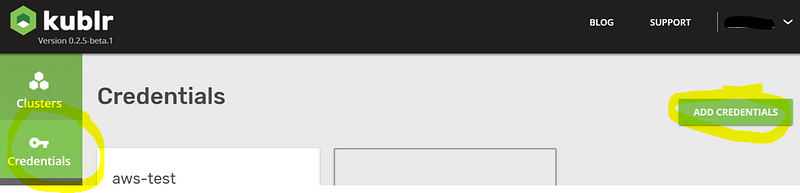
Select “Credentials” from the left sidebar, and click “Add credentials”.
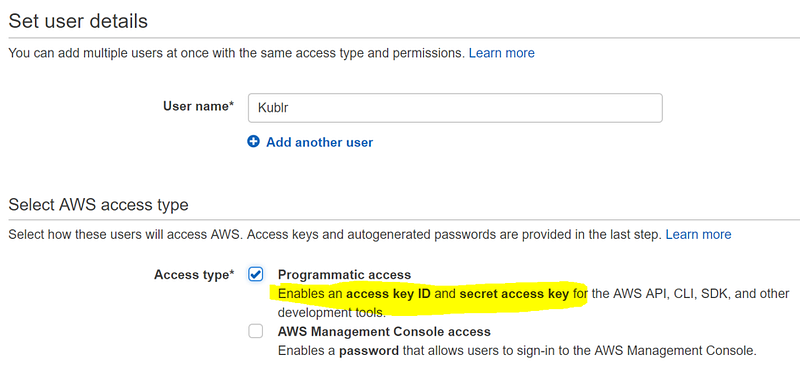
You must create an IAM user and IAM policy, and provide the access key and secret key of that IAM user. You can do this in your AWS account by navigating to “Services > IAM > Users” and clicking “Add user”.
Verify you have “Programmatic access” selected as shown below:
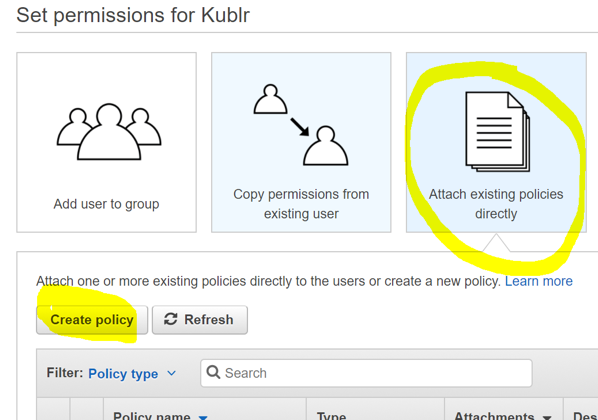
Click “Next”, select “Attach existing policies directly”, then click “Create Policy”.
On the new tab, select “Create your own policy”. Complete the “Policy name” and “Description” fields. The most important field is “Policy Document,” which specifies what permissions this policy grants the user.
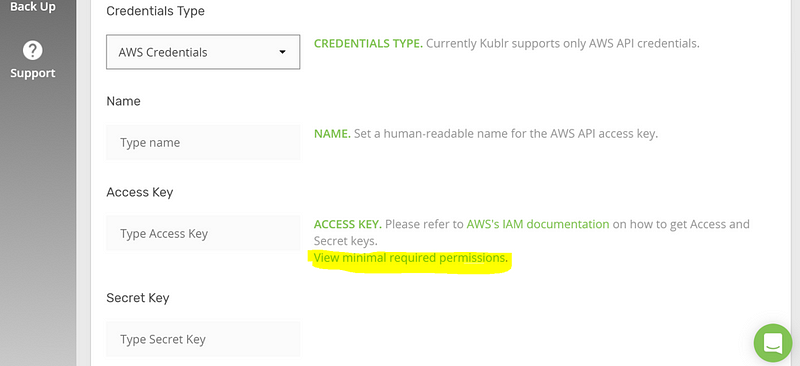
To copy the needed IAM Policy JSON that you should paste into this field, click “View minimal required permissions” as shown below:
Insert the JSON into “Policy Document”, and click “Create policy” to confirm creation.
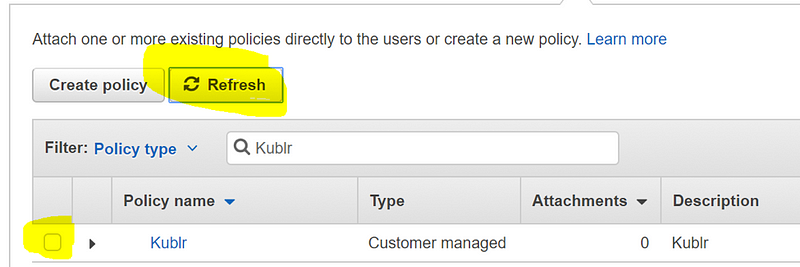
Return to the previous tab, and click “Refresh” to see your newly created policy. Select the policy, and click “Next”.
Complete the user creation by clicking “Create user”. If everything was completed successfully, you should see the following:
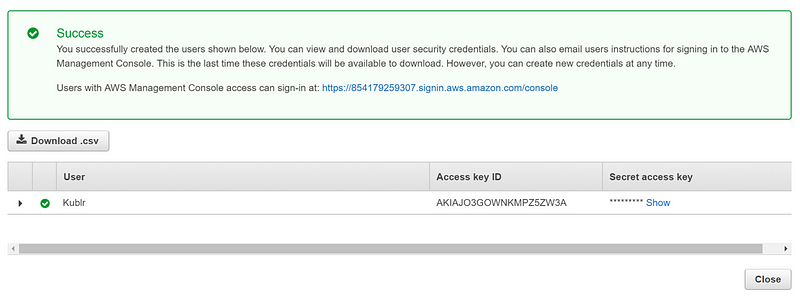
Download your newly created Access key and Secret key, and keep these in a safe place.
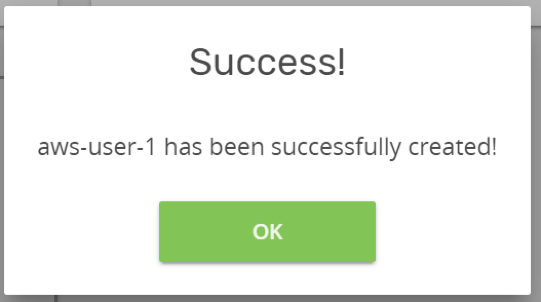
Navigate back to Kublr and complete the “Credentials” creation step by filling in the keys and clicking “Save Credentials”. You will see the following message box if your IAM user is working and the policy was set correctly. (I named my credentials “aws-user-1”.)
You can now create a new cluster, navigate to “Clusters” in the left sidebar, and click “Add Cluster”. Fill in the cluster name, select the AWS region to deploy to, the credentials to use (we have only one at the moment), the SSH key pair of choice (if you want the option to login to Kubernetes Master nodes that Kublr creates for you and explore the setup), and the operating system to use (Ubuntu 16 by default, at this time).
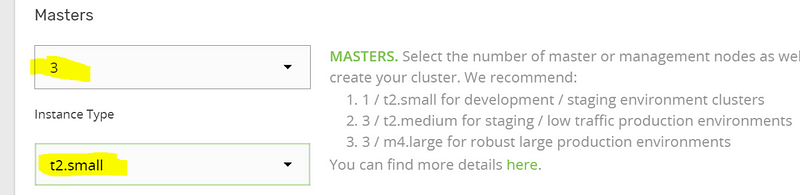
The most important decisions during cluster creation are the number of “Masters” and their “Instance Type”. For a production cluster, it’s recommended you use at least an “m4.large” instance type. But for our tutorial we can create a highly available cluster using smaller instances; so select “3” masters and a “t2.small” instance type.
The “Advanced options” will reveal an option to select availability zones manually, but we’ll leave this decision to Kublr. Proceed with selecting how many worker nodes to start with (these will be running your “pods”). We’ll specify 3 and, for their instance type, we’ll specify “t2.small” for this tutorial. You can also turn on the “auto scaling“ option in “Advanced options”.
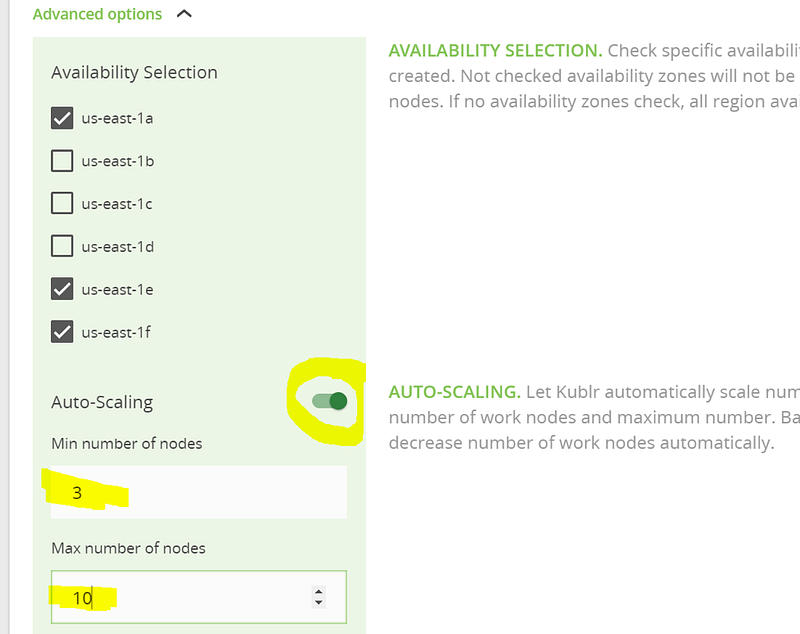
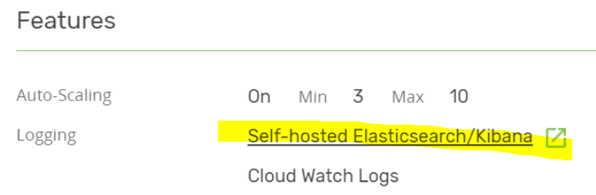
As you can see, we have set the maximum number of nodes to 10, so Kublr will only scale up to 10 worker nodes.
For logging and monitoring options, you have a choice of setting up Elasticsearch and Kibana automatically during cluster creation or using CloudWatch logs.
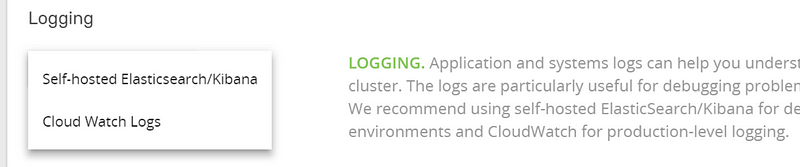
CloudWatch is recommended for production workloads. Let’s choose both “Self-hosted Elasticsearch/Kibana” and “Cloud Watch Logs”. This is possible because we can stream the logs to several targets.
Next, select the monitoring option:
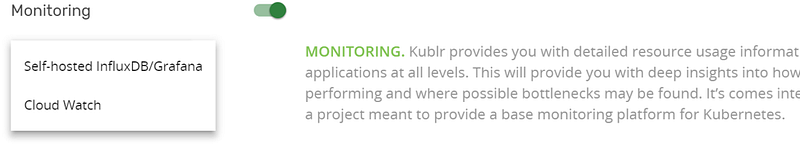
We’ll select self-hosted InluxDB/Grafana out of the box. If you prefer, you can also see the metrics in your Cloud Watch service.
The final section of the configuration is “Ingress”. You can enable this option to get ingress controllers deployed and ready to use. For this tutorial, you can either skip this option or enable it so you can try out ingress rules later.
Click “Confirm and install”, to create your cluster. You should see that the cluster is now being created. Click the “Overview” tab.
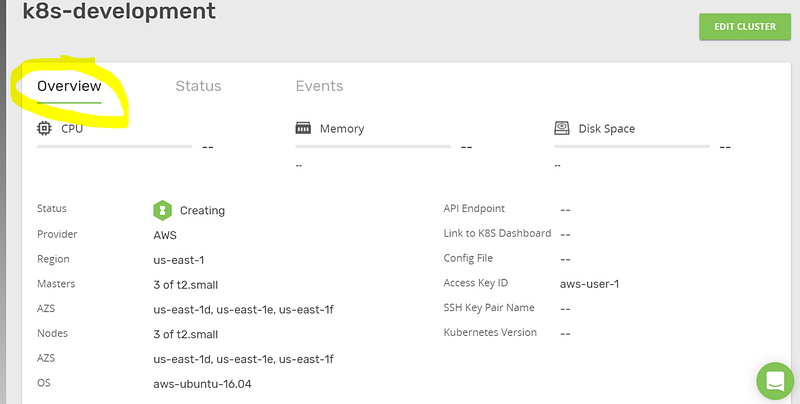
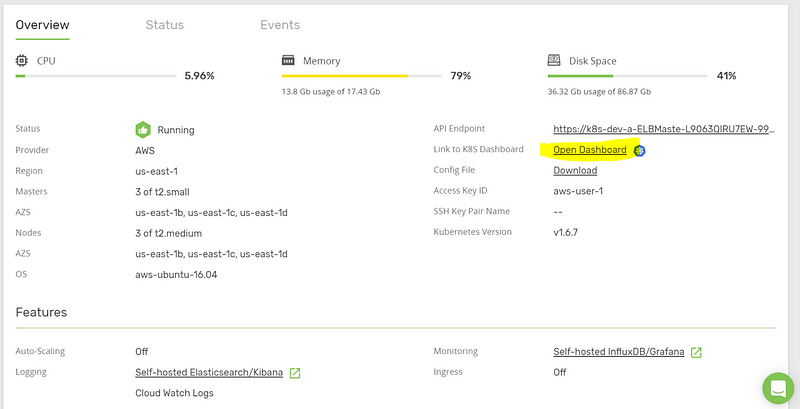
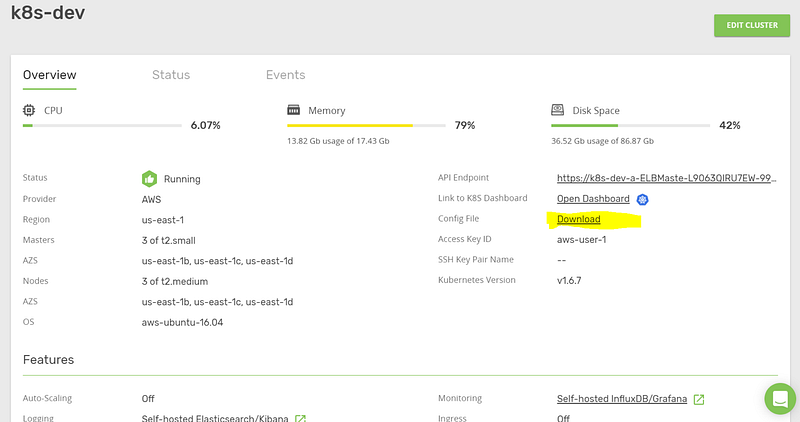
This page displays all information about your cluster setup. You should wait approximately five to ten minutes for AWS to create all requested resources (EC2 instances, EBS volumes, Auto scaling groups) and for Kublr to install all components into the cluster and bootstrap the master nodes. The Kubernetes documentation describes the great amount of work to create a custom cluster from scratch. This is why Kublr exists: to abstract away the complexity and allow the user to benefit from all features that Kubernetes provides.
When the process completes, open the Kubernetes dashboard from the “Overview” tab.
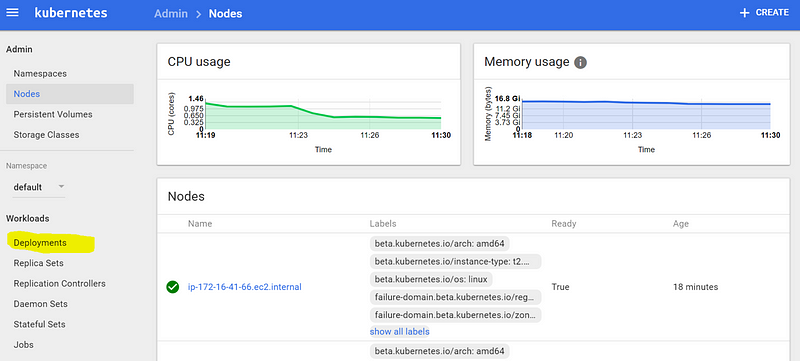
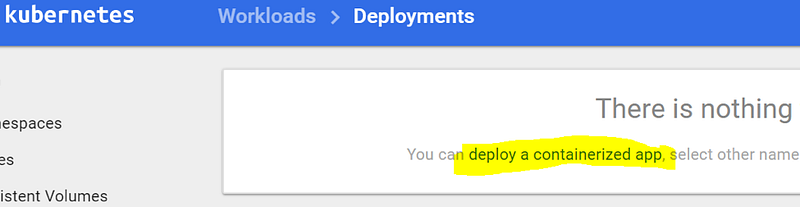
You will see the list of nodes available in your cluster. Navigate to “Deployments,” and click “deploy a containerized app”.
Save the following to a file named “blue-website-deployment.yaml”:
apiVersion: apps/v1beta1
 kind: Deployment
 metadata:
   name: blue
   namespace: default
 spec:
   replicas: 1
   template:
     metadata:
       labels:
         name: blue
     spec:
       containers:
       - name: blue-website
         image: aquamarine/kublr-tutorial-images:blue
         resources:
           requests:
             cpu: 0.1
             memory: 200
 ---
 apiVersion: v1
 kind: Service
 metadata:
   name: blue-website
 spec:
   ports:
   - port: 80
     targetPort: 80
     protocol: TCP
     name: http
   selector:
     name: blue
This contains a “Deployment” definition and a “Service”. These are Kubernetes resources. The “deployment” ensures an instance of our blue website container will run all the time and, if a worker node gets terminated and the container shuts down, Kubernetes will reschedule it on another node. The “Service” resource creates a new load balancer in your AWS account, and configures it to point to the blue website container.
Select “Upload a YAML or JSON file”, chose blue-website-deployment.yaml, and click “Upload”.
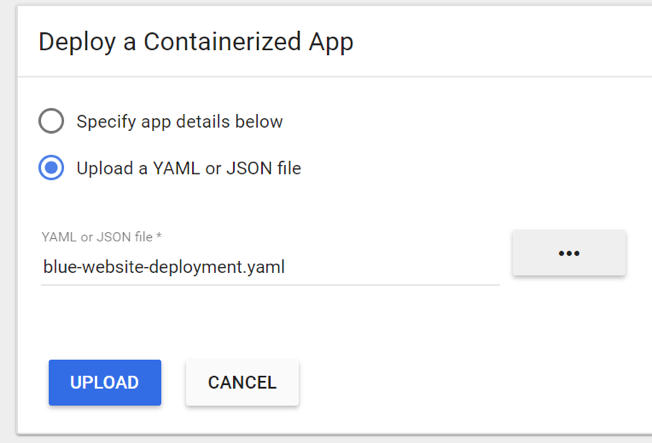
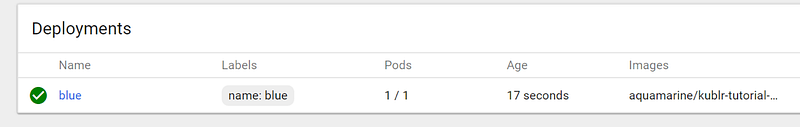
Both “deployment” and “service” will be created, and you can see this in the dashboard.
To see the “Service,” which is both an internal and external load balancer in our case (because the service manifest from our uploaded file contained the “type: LoadBalancer” parameter), click “Services” in the left sidebar.
You can see the “blue-website” service on the screenshot below:
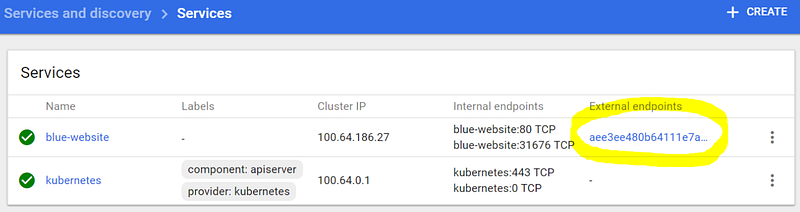
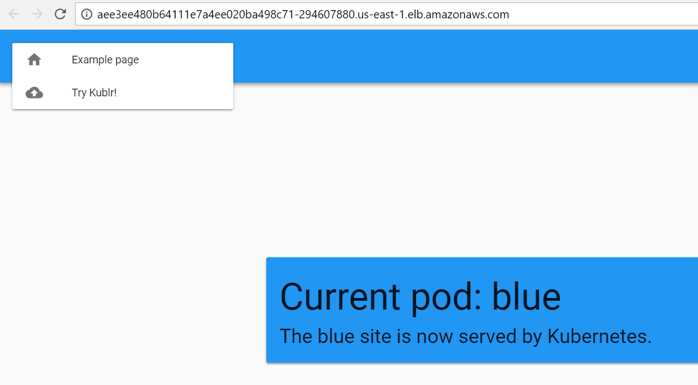
Click the external endpoint to navigate to our website, and you will see the blue demo page we just deployed.
After deploying the application, it’s time to check the logs to see if your application has any issues. As you’ll remember, we have installed our cluster with both logging options, Elasticsearch with Kibana and Cloud Watch logging target enabled. To access Kibana, download the configuration file from the Kublr “Overview” tab.
Copy the “Basic Auth” username and password.
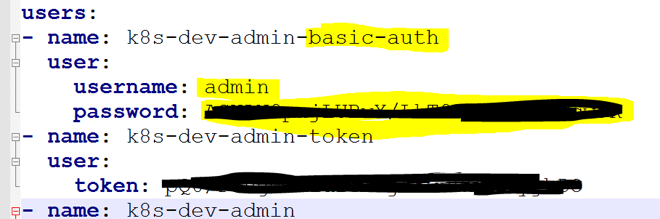
Open Kibana and log in.
When first logging in, you’ll see the creating index pattern page. Click “Create” and navigate to the “Discover” tab.
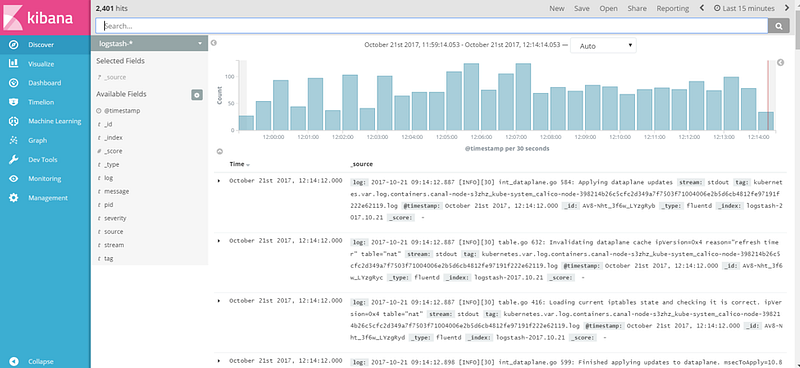
Here you can find all “stdout” and “stderr” outputs of all your containers and all Kubernetes components. Based on that, you can set alerts with ElastAlert (a popular tool for querying Elasticsearch periodically to detect patterns of error spikes, traffic anomalies, etc), and do any kind of analytics that this great EFK combo allows. (“E” for Elasticsearch, the search engine for all your logs; “F” for fluentd, the log collector; and “K” for Kibana, the querying and dashboarding solution.)
You can also see the logs in CloudWatch. If your current infrastructure is tightly integrated with this service already and you rely on CloudWatch Alarms and use the Events and Metrics, this logging option might be a better choice for you. To see the logs written by Kubernetes, navigate to CloudWatch, Logs, and click the log group.
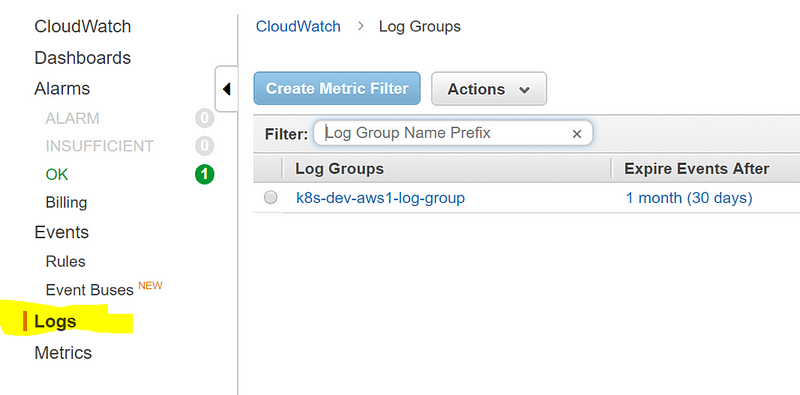
You will see the list of nodes from which those logs were collected. Select any of them, and try to search for a “tutorial” keyword. The node which hosts our demo container will have a few messages about pulling our docker image.
Let’s have a quick look at Grafana, the metrics dashboard. All container metrics are collected and stored in InfluxDB, which is a time series database. Grafana allows us to visualize those metrics. Here is an advanced tutorial on Grafana.
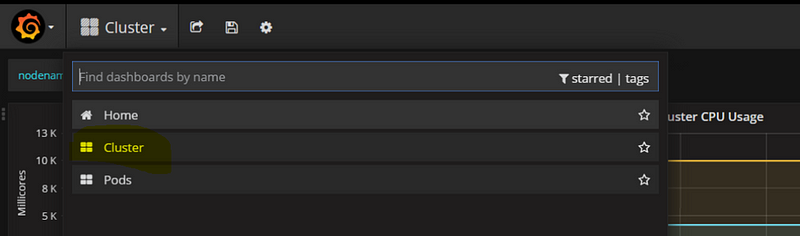
Navigate to Grafana from the “Overview” tab in Kublr, and use the same “Basic Auth” credentials we used for Elasticsearch. Then click the top menu, and select the “Cluster” dashboard.
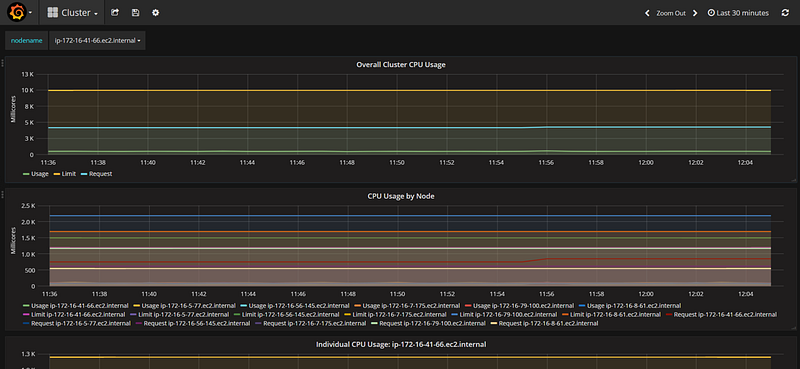
You will see both the overall cluster utilization and per node breakdown. You can select nodes to inspect from the top “nodename” combo box.
To see per container drilldown, select the “Pods” dashboard from the top menu. You can inspect every container utilization and setup alerts. Read more about Grafana alerting and notification features.
The possibilities are endless when using Kubernetes. But with ECS you cannot easily integrate Grafana metric collection or log collection to Elasticsearch. Getting logs from ECS services and instances is complicated. Kubernetes, however, allows us to use the latest features of all the open source technologies in this short tutorial, right out of the box.
Our previous tutorial covers almost every aspect of a recent Kubernetes release and describes possible use cases. Review the tutorial to learn about ingress rules and ingress controllers (advanced load balancing and routing), Stateful Sets and Replica Sets (stateful containers, with persistent storage, and fast scaling or failure recovery of replica sets), Config Maps and Secrets (helpful tools to pass sensitive information or dynamic templates to a container), and much more. To learn more about containerized stateful databases and services, check out our tutorials about MySql replication cluster on Kubernetes and How to run a MongoDB replica set on Kubernetes.
If you find the ECS service limited and not easy to use (when navigating through all resources and trying to understand the current state of 20–30 microservices when your infrastructure and application starts to grow) and your team does not have the capacity to learn the inner workings of Kubernetes master nodes and maintain the cluster manually, consider trying Kublr-in-a-Box.