
Introduction
A growing number of software developers are adopting the idea of microservices, where large, monolithic applications are broken down into individual modules. The benefits of the microservices model come with their own obstacles, however. Monitoring and repairing a broadly distributed system with many moving parts is tough for traditional tools like per-process logging and metrics monitoring. To track down something happening across multiple services, developers need a vendor-neutral, consistent API for tracing. That’s where OpenTracing comes in. Here, we will discuss OpenTracing and perform a demonstration of Jaeger, a distributed tracing system hosted by the Cloud-Native Computing Foundation (CNCF).
Definition of OpenTracing
OpenTracing is an open source distributed tracing standard for applications and Open Source Software (OSS) packages. It offers standardized APIs for span management, inter-process propagation, and data transfers. OpenTracing includes helper libraries in nine languages, including Go, JavaScript, Python, and Java.
OpenTracing starts by grouping named and timed operations called spans into a directed acyclic graph (DAG) called a trace. Each trace stores a single transaction and its workflow across the system.
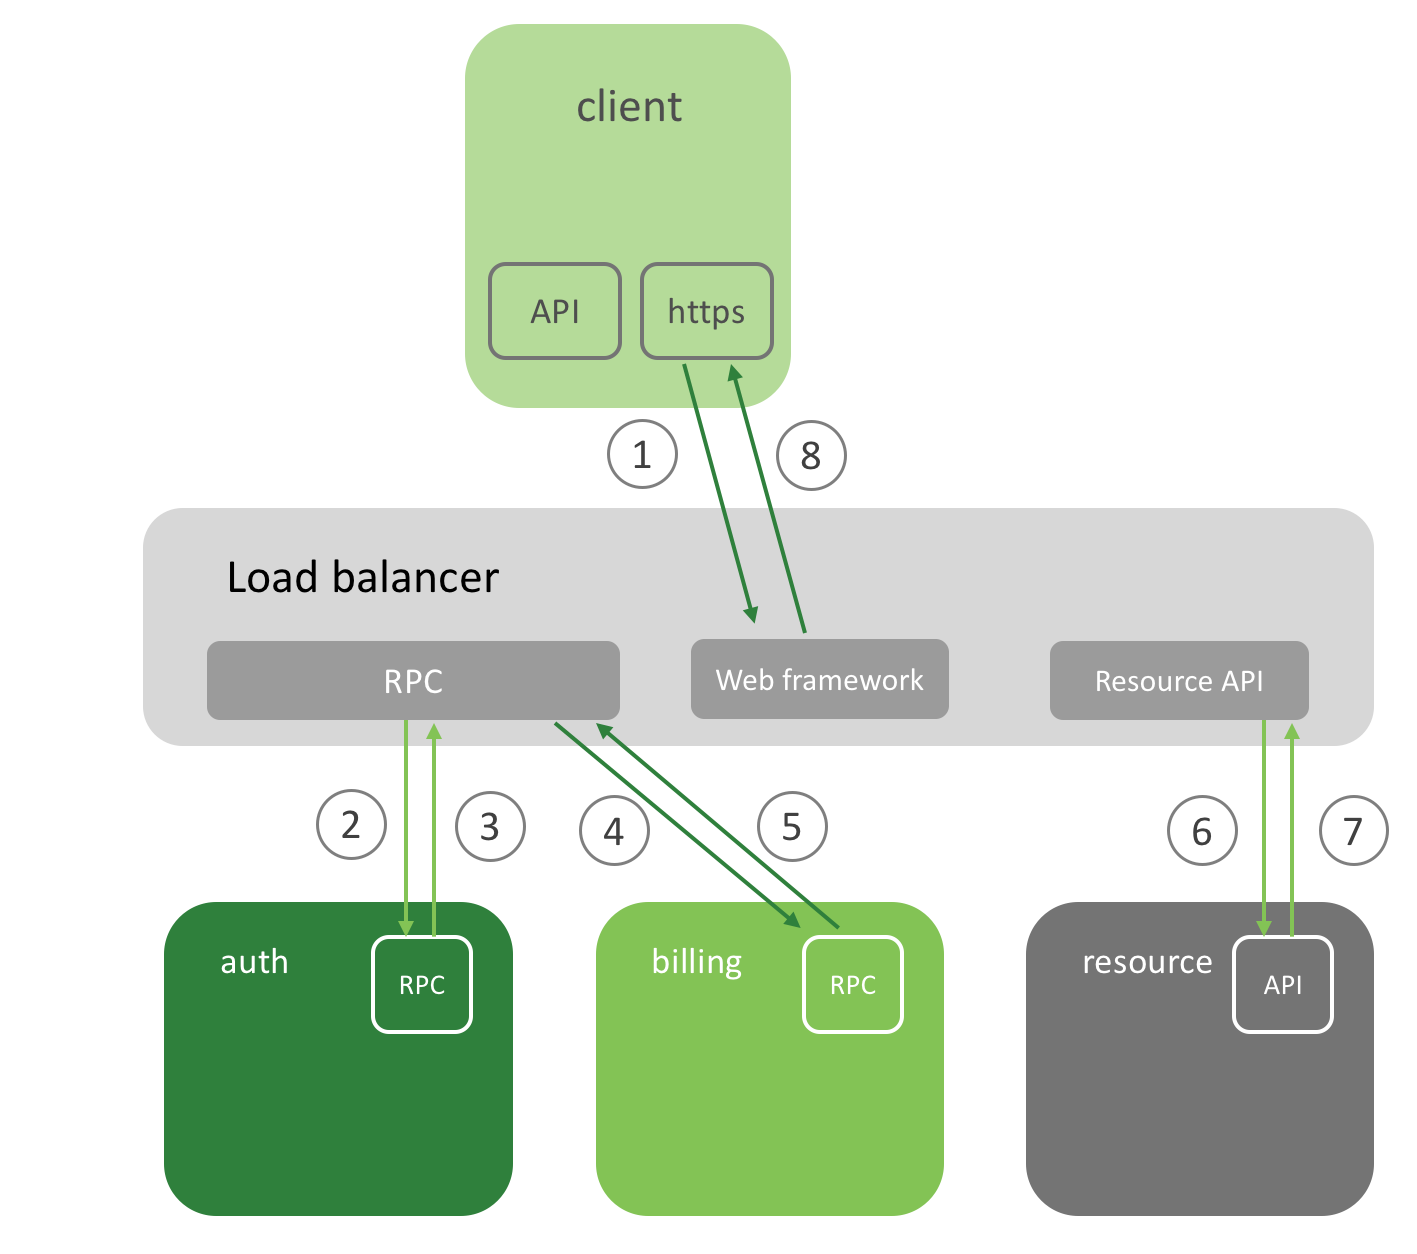
This image shows how a workflow or transaction through a distributed system is traced. While this type of visualization shows how components fit together, it’s usefulness is limited. It does not convey facets like latency or time required for these processes to run, and it doesn’t work well for scaling or parallelism. A better depiction can be seen below.
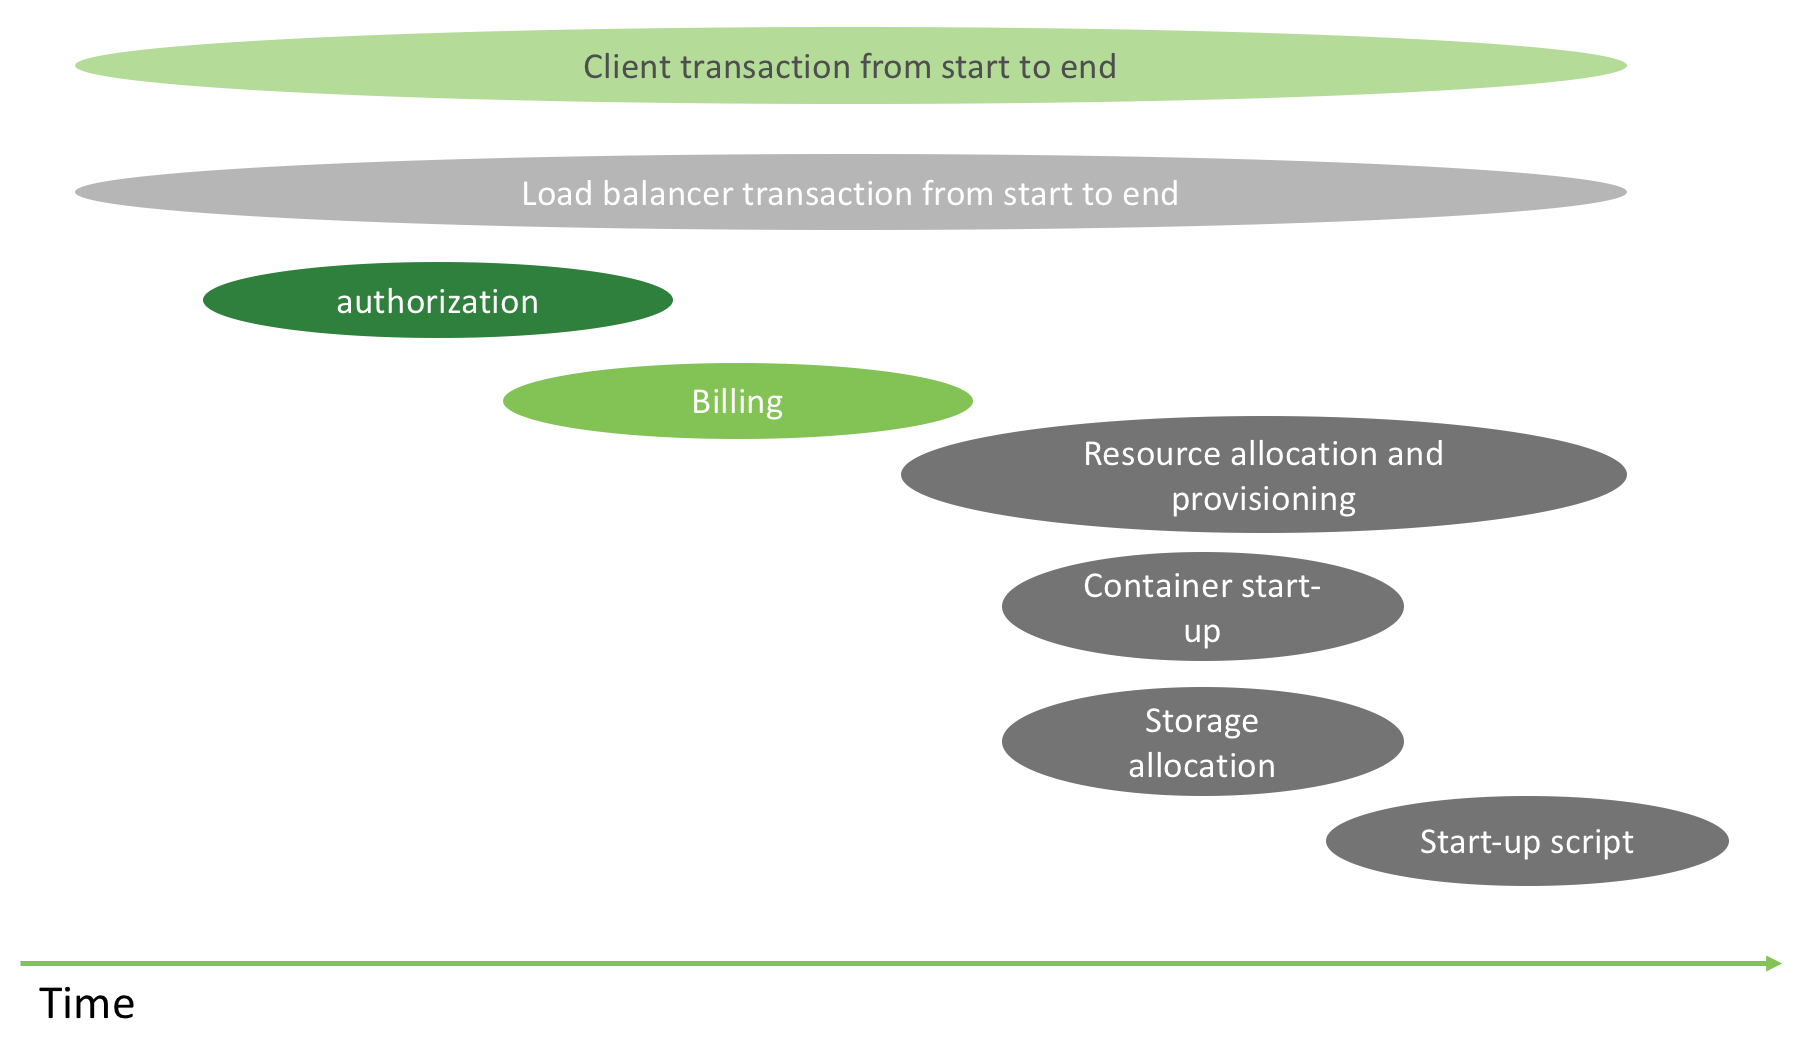
This visualization adds the context of time, the hierarchy of the services involved, and the serial or parallel nature of the process/task execution. Focusing on the critical path highlighted in this image makes it easier to spot where the most valuable improvements to the code can be made. For example, you might want to trace the resource allocation spans inside an API request to the underlying blocking calls.
You need to trace applications and OSS packages in order to visualize a transaction end-to-end. To do so, you need to examine all available elements of the microservices architecture relevant to the distributed system. This includes environment/resource management and resilience/fault tolerance. Tracing these elements is only feasible via Kubernetes, a polyglot cloud management platform that makes it possible for cloud-native applications to be measured and quantified more widely. Those numbers, in turn, provide invaluable insights, metrics, and instrumentation to distributed systems.
Jaeger is one of the many distributed tracing systems available today. Developed originally by Uber, it was released as an open source option to the public in 2017. Jaeger can be used for monitoring and troubleshooting microservices-based distributed systems. It also can be used for transaction monitoring, root cause analysis, service dependency analysis, performance/latency optimization, and high scalability.
Jaeger’s features include:
- Native support for OpenTracing Multiple storage backends Modern Web UI
- Observability
- Cloud-native Deployment on Kubernetes
Demo description
Here’s what Jaeger and OpenTracing-compliant instrumentation in Kubernetes looks like.
As a prerequisite to the following tutorial, you will need a running Kubernetes cluster. You can get this set up using our demo, Kublr-in-a-Box in a few minutes. Kublr-in-a-Box provides you with an easy UI installation on bare metal, AWS, and Azure. In this demo, the cluster is made of one master and two nodes, but you can repeat this demo in any sized cluster, on-premise or in the cloud.
Jaeger, when deployed in production, is made of five components:
- Cassandra (or Elasticsearch)
- Collector
- Agent
- Schema
- Query UI
If you use the Jaeger-all-in-one, Prometheus will be deployed as well.
For our example application, we will use the following repository with a Java demonstration of an OpenTracing-compliant tracer, decorated with
support for reporting span-based application metrics. The demonstration labels the metrics under the following types:
Label types:
- ConstMetricLabel – Returns a constant value, e.g. service name
- OperationMetricLabel – Returns the span’s operation name
- TagMetricLabel – Obtains the value associated with the requested name from the span’s tags or returns default value if no tag is found.
- BaggageMetricLabel – Obtains the value associated with the requested name from the span’s baggage items or returns default value if no tag is found.
Default Labels:
- operation
- span.kind – the span.kind tag associated with the span. If not specified, no metric will be recorded.
- error – the error tag (false by default)
The demonstration code has two services: ordermgr and accountmgr. The first creates three endpoints for the end user, as below:
ordermgr/OrderMgrController.java
(...)
    @RequestMapping("/buy")
    public String buy() throws InterruptedException {
        Thread.sleep(1 + (long)(Math.random()*500));
        Optional.ofNullable(tracer.activeSpan()).ifPresent(as -> as.setBaggageItem("transaction", "buy"));
        try (Scope scope = tracer.buildSpan("SomeWork").startActive(true)) {
            scope.span().setTag("work", "buying");

            ResponseEntity<String> response = restTemplate.getForEntity(accountMgrUrl + "/account", String.class);
            return "BUY + " + response.getBody();
        }
    }

    @RequestMapping("/sell")
    public String sell() throws InterruptedException {
        Thread.sleep(1 + (long)(Math.random()*500));
        Optional.ofNullable(tracer.activeSpan()).ifPresent(as -> as.setBaggageItem("transaction", "sell"));
        ResponseEntity<String> response = restTemplate.getForEntity(accountMgrUrl + "/account", String.class);
        return "SELL + " + response.getBody();
    }

    @RequestMapping("/fail")
    public String fail() throws InterruptedException {
        Thread.sleep(1 + (long)(Math.random()*500));
        ResponseEntity<String> response = restTemplate.getForEntity(accountMgrUrl + "/missing", String.class);
        return "FAIL + " + response.getBody();
    }
(...)
accountmgr/AccountMgrController.java
(...)
    @RequestMapping("/account")
    public String getAccount() throws InterruptedException {
        Thread.sleep(1 + (long)(Math.random()*500));
        if (Math.random() > 0.8) {
            throw new RuntimeException("Failed to find account");
        }
        return "Account details";
    }
(...)
All of the methods have a random delay function, adding some entropy in the numbers reported.
We will deploy the application in our Kubernetes cluster together with Jaeger to trace all data reported. Finally, the script simple/genorders.sh will be executed to generate random events in the application.
Implementation
Let’s begin by setting up Jaeger. We will use the jaegertracing/jaeger- kubernetes all-in-one template to load all parts in the current namespace, which is suitable to local development and testing.
kubectl create -f https://raw.githubusercontent.com/jaegertracing/jaeger-kubernetes/master/all-in-one/jaeger-all-in-one-template.yml
For production setup, this link has more instructions.
Once everything is ready, running the kubectl get service jaeger-query should return the Jaeger URL.
The next step is to clone the source code, run Maven to build the container, and push it to Kubernetes:
git clone https://github.com/objectiser/opentracing-prometheus-example.git
cd opentracing-prometheus-example/simple
eval $(minikube docker-env)
mvn clean install docker:build
kubectl create -f services-kubernetes.yml
Once everything is ready, running kubectl get service ordermgr should return ordermgr URL REST endpoint.
Now that everything is setup, run ./genorders.sh to simulate transactions and generate data to trace. We are now ready to play with the Jaeger UI:
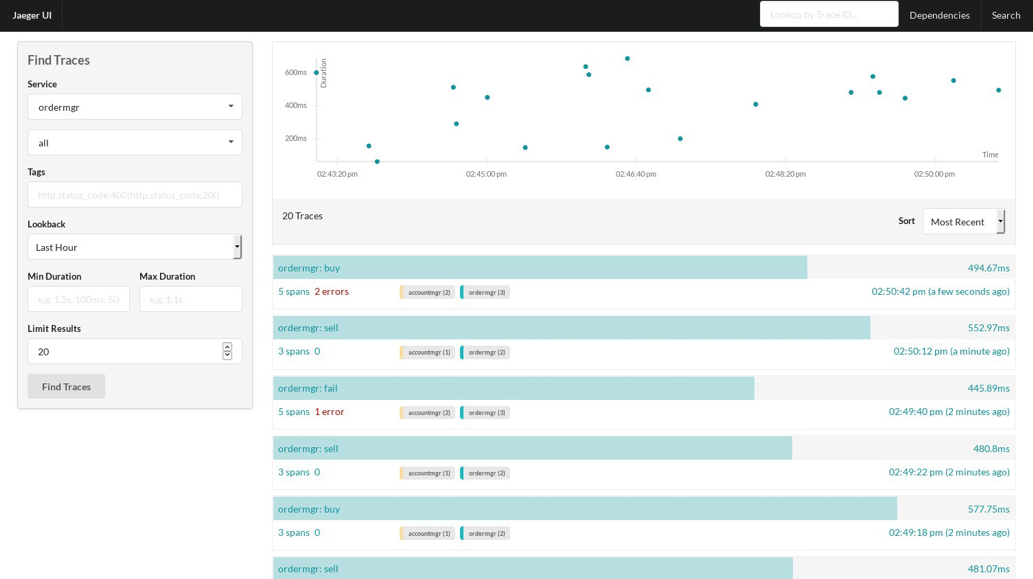
Clicking in any trace should load its details:
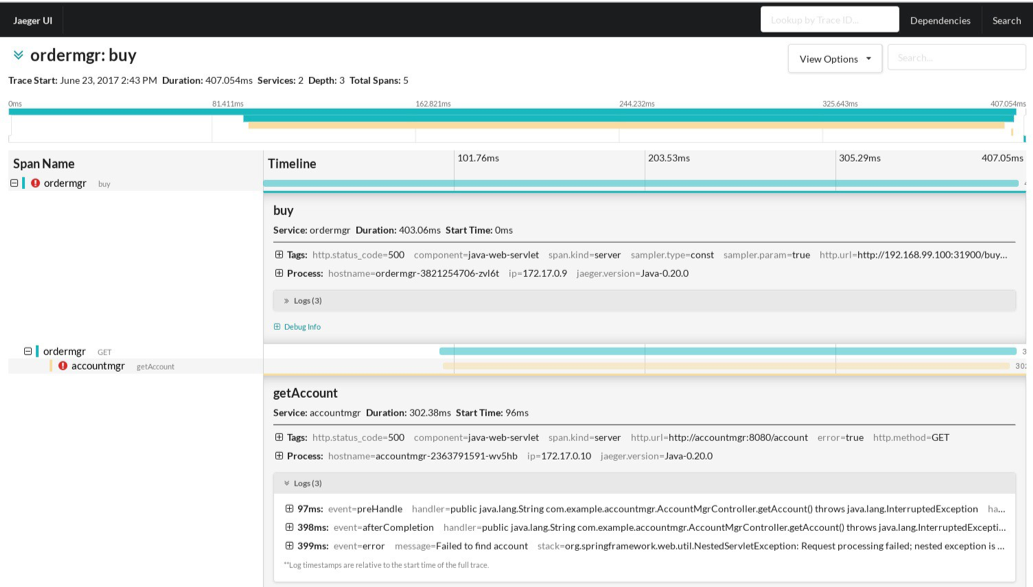
Where you see three spans, the first is a /buy request on ordermgr, the second is ordermgr consuming accountmgr, and the third is accountmgr receiving the /hello call. You can see that accountmgr reported an error (as indicated by the tag error=true).
Conclusion
Distributed tracing is a key component for properly monitoring a microservices-based architecture. With the acceptance of CNCF to host Jaeger, there is native support to collect metrics using the OpenTracing standard in a cloud-native deployment. These metrics can later be consumed by Prometheus or another metric backend—a topic we will expand on in a future post.