
Kublr and Kubernetes can help make your favorite data science tools easier to deploy and manage. Hadoop Distributed File System (HDFS) carries the burden of storing big data; Spark provides many powerful tools to process data; while Jupyter Notebook is the de facto standard UI to dynamically manage the queries and visualization of results. And Kublr and Kubernetes make it easy to deploy, scale, and manage them all — in production and a stable manner with failover mechanisms and auto-recovery in case of failures.
We’ve created a tutorial to demonstrate the setup and configuration of a Kubernetes cluster for dynamic Spark workloads. The primary benefits of this configuration are cost reduction and high performance.
How is it possible to reduce cost and improve performance with Kubernetes? The short answer is autoscaling offers the cost reduction, while affinity rules boost performance.
Spark is superior to Hadoop and MapReduce, primarily because of its memory re-use and caching. It is blazing fast but only as long as you provide enough RAM for the workers. The moment it spills the data to the disk during calculations, and keeps it there instead of memory, getting the query result becomes slower. So, it stands to reason that you want to keep as much available memory as possible for your Spark workers. But, it’s very expensive to keep a static datacenter of either bare metal or virtual machines with enough memory capacity to run the heaviest queries. Since the queries which demand a peak resource capacity are not frequent, it would be a waste of resources and money to try and accommodate the maximum required capacity in a static cluster.
The better solution is to create a dynamic Kubernetes cluster which will use the needed resources on-demand and release them when the heavy lifting is not required anymore. This is a good solution to cover many common situations, like a summary query that runs just once a day, but consumes 15 Terabytes of memory across the cluster to complete the calculations on time and presents the summary report to a customer’s portal. It would be expensive to keep 15 Terabytes of memory as a static cluster (which is equivalent to 30 huge bare metal machines or 60-80 extra-large virtual machines if we consider AWS), when your average daily needs for memory are just around 1-2 Terabytes and are fluctuating.
Tutorial: Dynamic Spark workloads on Kubernetes
We will use the following tools:
- Jupyter Notebook and Python 3.6 for queries
- Spark 2.4.0 (Hadoop 2.6) for data processing
- Kubernetes cluster created by Kublr
Features of the setup:
Jupyter Notebook
- PySpark is already installed
- Notebooks are persistent (stored on EBS disks)
HDFS (optional)
-
Default installation includes:
- 2 namenodes, 1 active and 1 standby, with 100 GB volume each
- 4 datanodes
- 3 journalnodes with 20 GB volume each
- 3 zookeeper servers (to make sure only one namenode is active) with 5 GB volume each
- HDFS client pod
-
Persistent data
-
Reliability: even if all pods fail, they are recovered automatically, and previously stored data is available. However, transparent failover during working with HDFS from Jupyter Notebook is not guaranteed, at least because active and standby name nodes can swap.
Spark 2.4.0 (Hadoop 2.6)
- Kubernetes creates as many workers as the user requests creating a SparkContext in Jupyter Notebook
- Kubernetes deletes workers automatically when the user stops the SparkContext or the Python3 kernel in Jupyter Notebook
- Kubernetes restores failed workers automatically, even during calculations. A restored worker picks up and completes the work interrupted by the failure, so the failover is transparent to users.
- Multi-user work is supported: each user can create their own independent workers
- Data locality: Data processing is performed in such a way that the data stored on the HDFS node is processed by Spark workers executing on the same Kubernetes node, which leads to significantly reduced network usage and better performance.
Auto-scaling Kubernetes cluster
- Automatic creation of more Kubernetes nodes (scale-out) when there are no more resources for spark workers
- Automatic scale-in when the load is low, to decrease costs
Preparing Docker images for Jupyter Notebook and Spark workers
Preparing Docker images for Jupyter Notebook and Spark workers
We have already prepared all the necessary images for this tutorial. If that works for you, then skip to the next part of the tutorial.
If you want to customize the Docker images (e.g. with newer versions of the components or some files required in your production setup) start here.
Clone our demo repo, and switch to the proper folder:
git clone https://github.com/kublr/demos.git
cd demos/demo9-jupyter-pyspark
Then, download and unpack the Spark distribution. You can use the following commands:
wget http://archive.apache.org/dist/spark/spark-2.4.0/spark-2.4.0-bin-hadoop2.6.tgz
tar xvzf spark-2.4.0-bin-hadoop2.6.tgz
rm spark-2.4.0-bin-hadoop2.6.tgz
For convenience, let’s create a short named symlink spark to the distro:
ln -s spark-2.4.0-bin-hadoop2.6 spark
You’d want to build the Docker image <your account>/spark-py:2.4.0-hadoop-2.6 with Spark and Python. Hereafter, replace kublr by your Docker Hub account name in the following command and run it:
(cd spark && bin/docker-image-tool.sh -r docker.io/kublr -t 2.4.0-hadoop-2.6 build)
Push the image to the Docker Hub so Kubernetes will be able to create worker pods from it. You likely have to call docker login at first, to be able to upload the new image. After logging in, upload it with:
docker push kublr/spark-py:2.4.0-hadoop-2.6
After we have completed the Spark image creation, you can customize the Jupyter Notebook image in “jupyter/Dockerfile” file, and then build and push the image with these commands (substitute the Docker Hub account name to the needed one):
docker build -t kublr/pyspark-notebook:spark-2.4.0-hadoop-2.6 -f jupyter/Dockerfile .
docker push kublr/pyspark-notebook:spark-2.4.0-hadoop-2.6
At this stage, you have your custom Spark workers image to spawn them by the hundreds across your cluster, and the Jupyter Notebook image to use the familiar web UI to interact with Spark and the data in your cluster.

Creating a Kubernetes Cluster Using Kublr
In the following example, we’ll use Amazon Web Services (AWS) to run our cluster. There are numerous other options to choose from (e.g. Azure, GCP, bare metal, VMware cloud, and vSphere). You can even use your existing cluster for this tutorial.
To manage the necessary AWS resources, such as EC2 instances, Elastic Load Balancers, and Route53 DNS records, a set of valid AWS IAM credentials is required.
You can create them in the “Credentials” section of the Kublr management dashboard. When these are ready, navigate to the “Clusters” section, click “Add cluster” and proceed with filling in the required details:
- Give any name to your cluster.
- Click on the “AWS” provider (or if you’re creating on another provider, select it, and proceed with all other details intuitively. The fields to select next will differ a little from one provider to another but are relatively self-explanatory.
- Select the AWS IAM credentials for cluster creation.
- Use any region from the available regions list
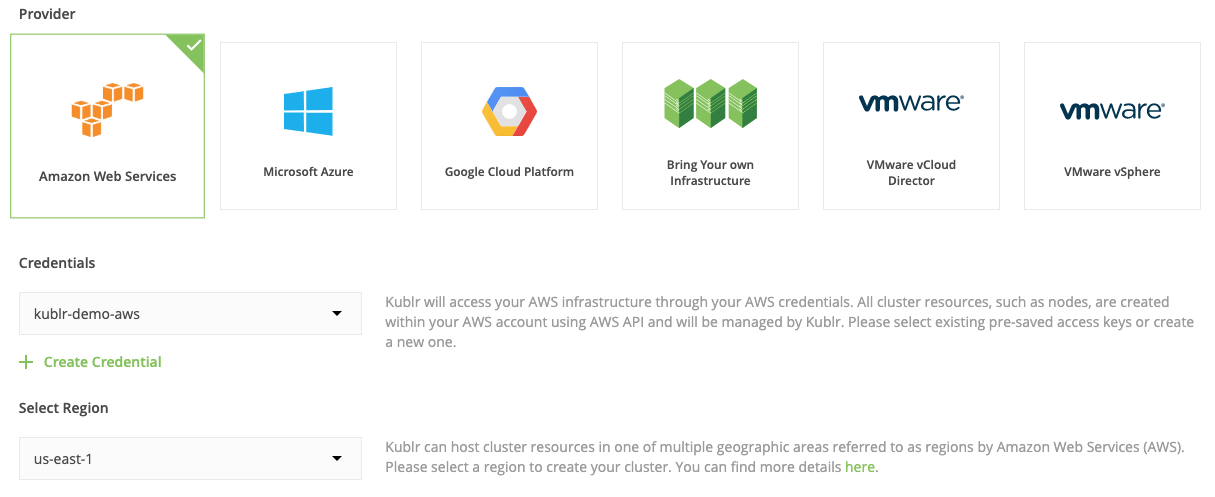
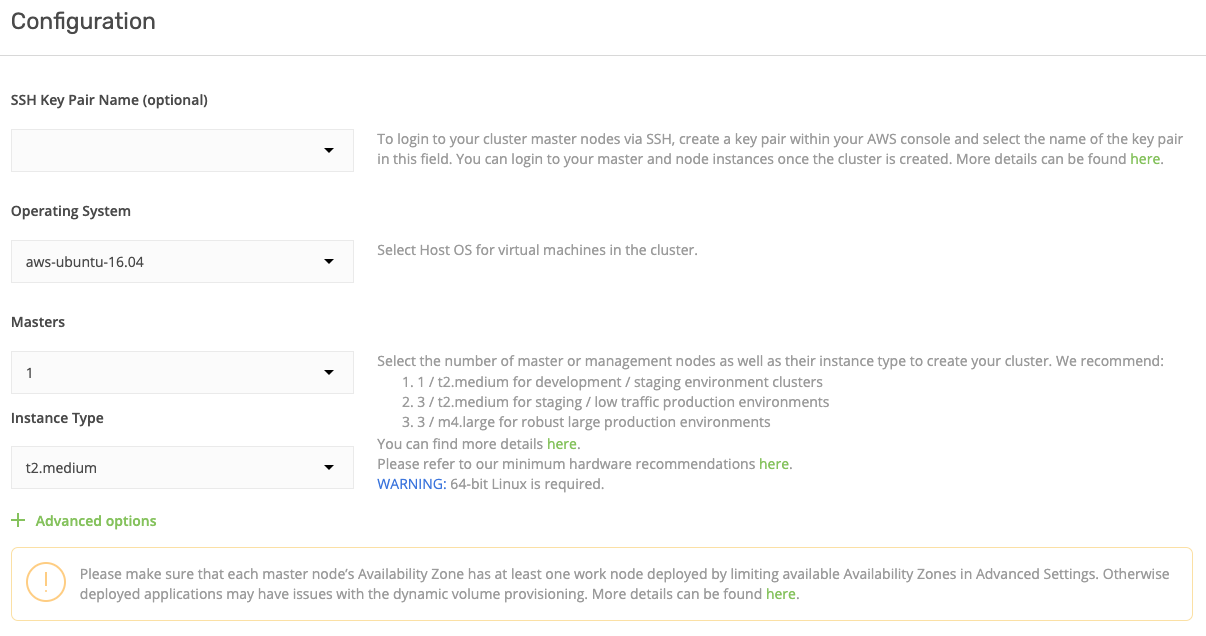
- You can leave the Operating-System selected as is, Ubuntu 16.04.
- A single master cluster will be fine for testing purposes.
- The master instance type is t2.medium by default, it should be enough for the test. But if you want to add more components into your cluster, which might put a heavier load on the master instance, select a larger type.
- In the “Create nodes” section, leave the Nodes Count field empty, we are going to enable auto-scaling in the bottom section, so this field value doesn’t matter.
- Select an instance type for workers to be t2.xlarge. We’re going to use quite a lot of components.
- Choose any Availability Zone — it won’t affect our setup.
- Enable auto-scaling! It’s one of the most powerful features of Kublr’s Kubernetes setup. Auto-scaling will be configured regardless of which cloud provider you select to deploy the cluster.
- Set the minimum number of nodes as “2”, and the maximum as “4” (or more, if you want to experiment with this mechanism on a larger scale). What does this mean? When Spark workloads increase, Kubernetes will notify the underlying infrastructure (in our case the AWS API ) that it needs more worker nodes. Worker nodes will then be created on-demand. When the Spark workloads decrease again, Kubernetes notifies the AWS API. The cluster is scaled down by shutting down all idle nodes leading to significant cost reductions. Keeping a high capacity pool of machines available 24/7 isn’t required with autoscaling
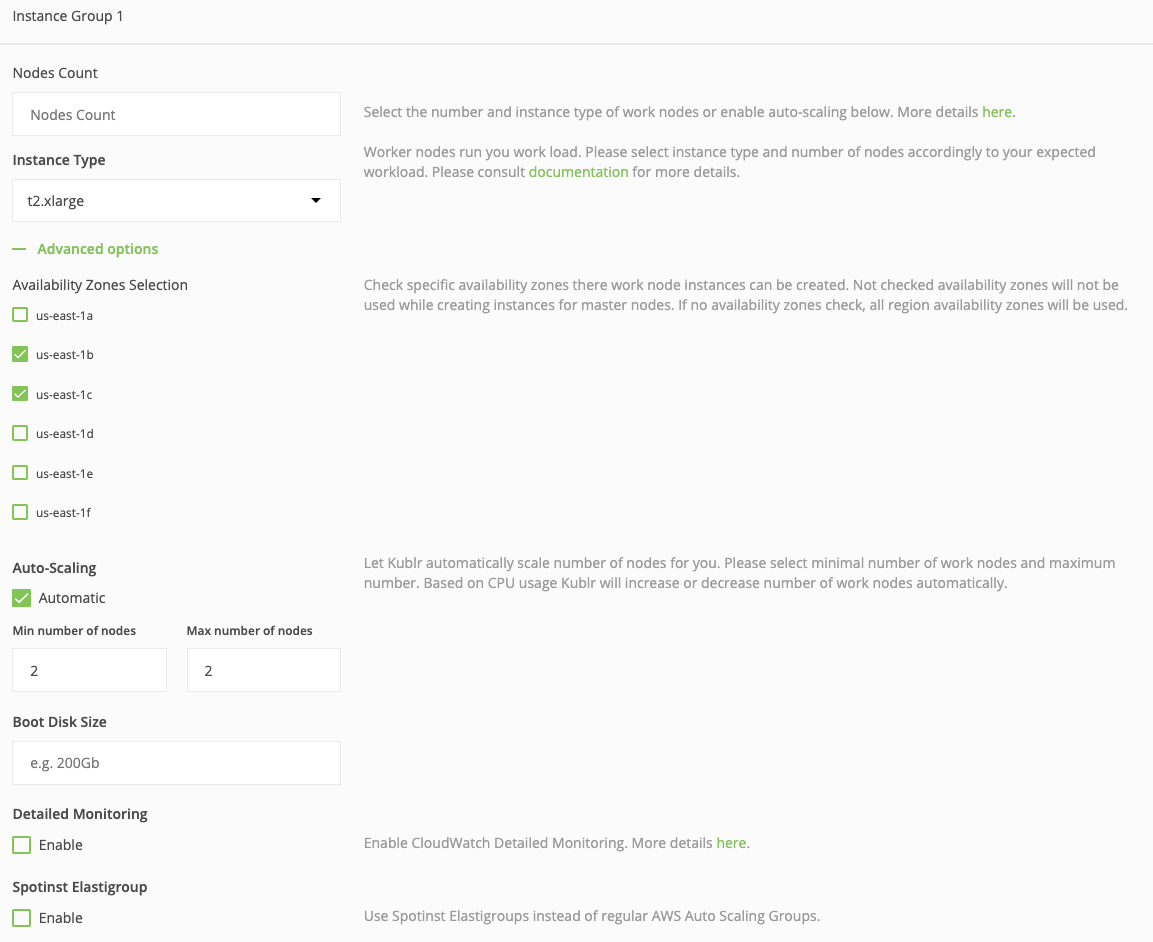
At this point, the configuration of the scaling groups for worker nodes is complete, but let’s take a moment to highlight an extremely effective feature for cost reduction…
Now find the checkbox named “Spotinst Elastigroup.” If you’re not familiar with Spotinst (don’t worry if you aren’t–it’s a relatively new service), you may not even notice it. Guess what, checking that little box may reduce your infrastructure cost by a whopping 70 percent!
This option activates Kublr’s Spotinst integration. Spontinst will manage your instances by placing automatic bids on the AWS Spot marketplace, using spare AWS capacity at a fraction of the price. Nice! But — yep, I’m afraid there is a but — there is a catch, but with a workaround. These instances may be terminated within a two-minute notice. There is a trigger event for a custom script that can be called when such a “notice” is received by Spotinst Elastigroup so that you can run cleanups or “drain node” in the Kubernetes cluster.
The terminated instances will be automatically replaced by Spotinst while bidding on other instance sizes or regions (there are settings for all of that). If you’re interested in trying this option, read the official documentation of Elastigroup. Get your Spotinst API token and enable the checkbox. It will ask you for “Spotinst account token.” Use the API key there, and Kublr will handle the rest of Elastigroup configuration for this cluster.
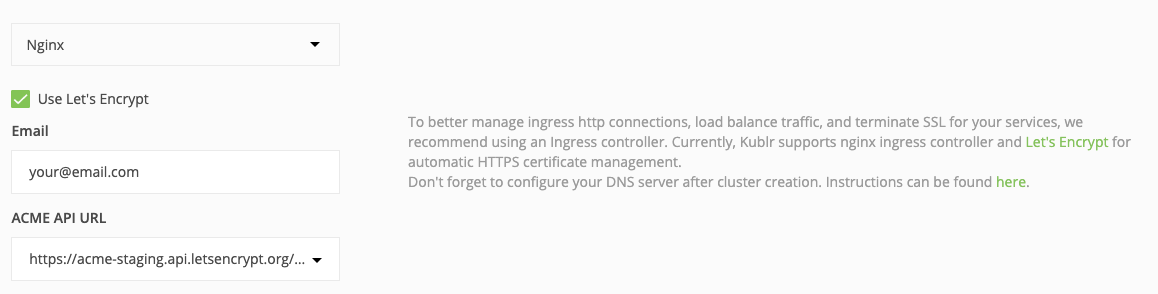
Let’s get back to the rest of our demo cluster settings. An ingress controller is required to expose Jupyter Notebook to the Internet, so expand the “Ingress Controller” section of the cluster settings. To configure HTTPS for your endpoint, select Use Let’s Encrypt and provide the needed parameters (like in the example below). Otherwise, a self-signed SSL certificate will be used and web browsers will complain about security. For this tutorial that’s ok so you can leave it empty and just press “Confirm and install.”
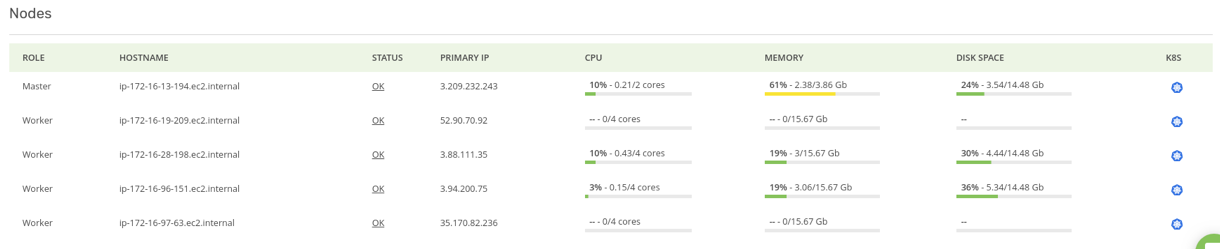
The creation may take 15 minutes or longer, depending solely on the underlying cloud provider. When the cluster is up and running, the Kublr dashboard looks like this:
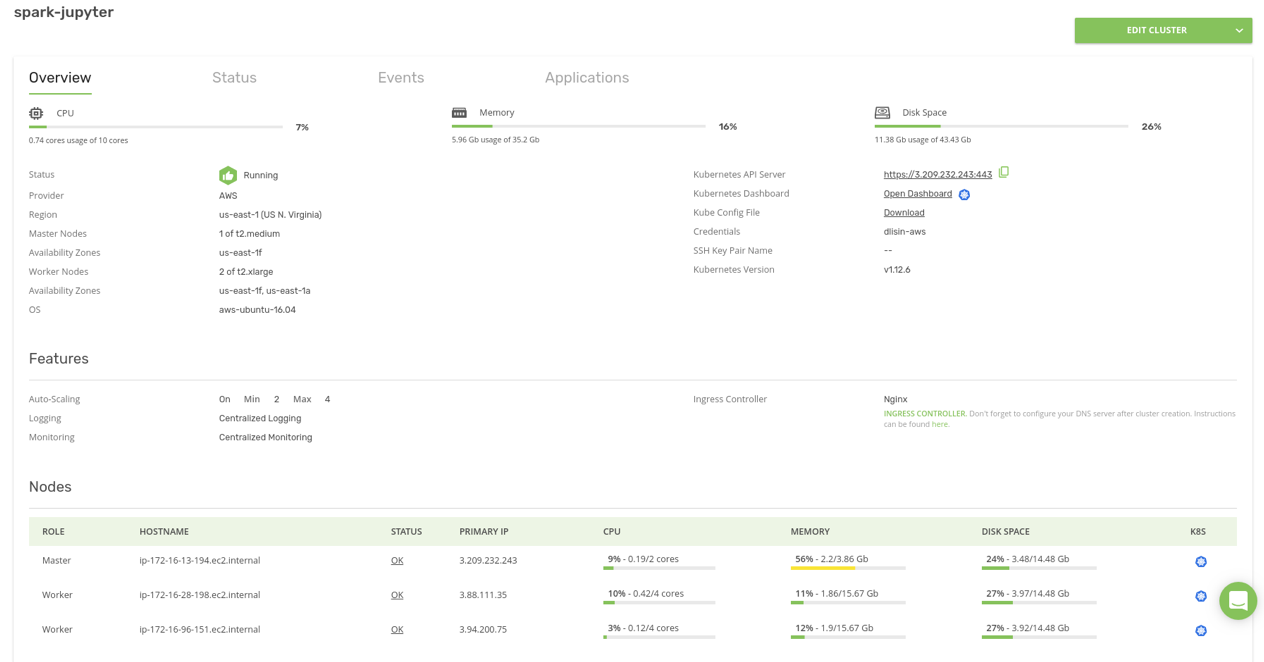
Note that the cluster contains one “Master” and two “Worker” nodes, the minimum number of worker nodes that we have specified in the auto-scaling settings.
To use kubectl and helm with the new cluster, you’ll need to download the Kube Config File from the Kublr dashboard. Save it locally in ~/.kube/config on the operator workstation (probably your laptop, or a bastion host if you work through a bastion).
Finally, let’s open the Kubernetes Dashboard. Click Open Dashboard.
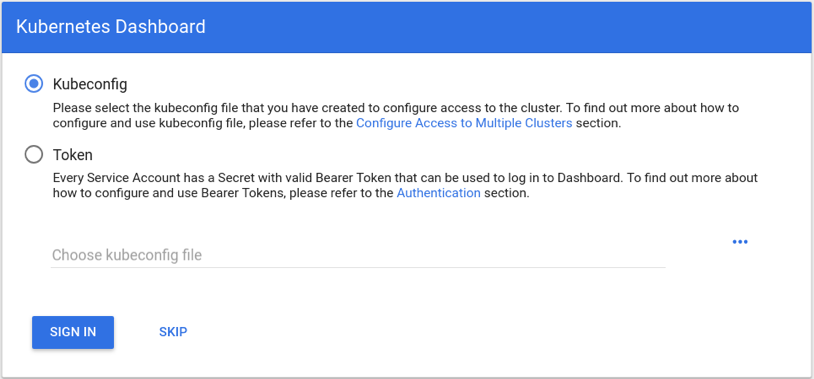
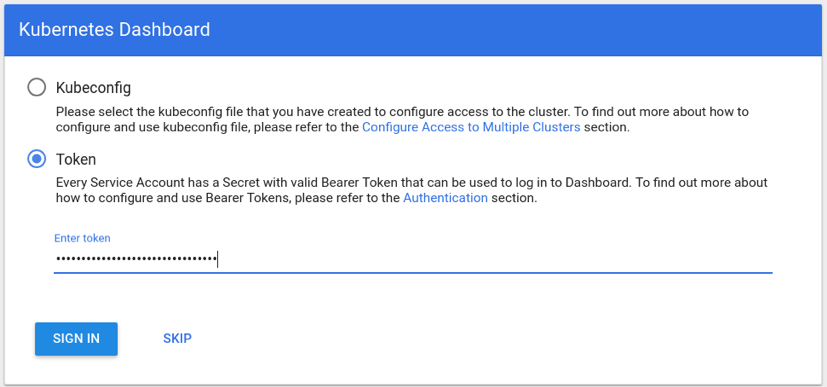
Authentication is required. To get a token from the downloaded ~/.kube/config file, run:
cat ~/.kube/config | grep token
This command prints something similar to:
- name: spark-jupyter-admin-token
token: xxxxxxxxxxxxxxxxxxxxxxxxxxxxxxxx
The “token” value is what we need for authorization. Just copy-paste it into the login form and click “Sign in”:
Alternatively, you can use the Kubernetes Dashboard in a read-only mode if you click SKIP. It will log you into the dashboard as an anonymous user, which is read-only mode by default. You won’t be able to see some of the resources (e.g., “secrets”) or change them — this mode isn’t really convenient.
Installing Jupyter Notebook
Now, we have a minimal working cluster. Spark and other components are yet to be installed. Let’s start with Jupyter Notebook. It’s an easy first step for warm-up. Clone the Kublr demo repository with this example manifests:
https://github.com/kublr/demos/tree/master/demo9-jupyter-pyspark.
We’ll install it with Helm as a Helm chart.
First upgrade Tiller on the server, just in case your local “helm” version is newer than that in your cluster by default:
helm init --upgrade
Wait a minute while it upgrades. Install Jupyter Notebook as a chart from the official upstream location. my-pyspark-notebook is a sample name for this chart “instance”. You can give it any name, which will appear in the “helm list” when you check what’s installed in the cluster:
helm install -n my-pyspark-notebook charts/pyspark-notebook
Please note: It is totally fine if the Kubernetes dashboard shows an error like this for a short time during the creation process of the pod:
pod has unbound immediate PersistentVolumeClaims (repeated 2 times)

AttachVolume.Attach failed for volume "pvc-82ebda50-6a58-11e9-80e4-02a82483ac0c" : "Error attaching EBS volume \"vol-02b63505fb00f7240\"" to instance "i-02b46ac14d1808b6d" since volume is in "creating" state
It will disappear when a volume for these pods is created. When everything is complete, you will be able to see both the pods and the “service” of Jupyter Notebook.
Associating a custom domain name with ingress hostname
When you create a cluster in AWS, Kubernetes assigns a dynamic Load Balancer for the ingress controller. Whether it’s an nginx controller or AWS ELB controller doesn’t matter. You will still need to find out its name and DNS address. Get the ingress controller hostname using the following command:
kubectl get service -n kube-system kublr-feature-ingress-nginx-ingress-controller -o 'jsonpath={.status.loadBalancer.ingress[0].hostname}'
What it does, is read a “service” definition from the cluster in the “kube-system” namespace, and display the value of the field we requested:
{.status.loadBalancer.ingress[0].hostname}
In the case of AWS, it should print something like this ELB address:
aa5e1e16a543111e9ae3d0e6004935f1-473611111.us-east-1.elb.amazonaws.com.
Configure your domain, so it points to that hostname — you can create a “CNAME” or an “A” alias record. If your DNS hosted zone is in Route53, it’s better to create an alias. You won’t be charged for name resolution (for more differences between these two types of Route53 records, please refer here).
Accessing the Jupyter Notebook web interface
To navigate to the web UI, we need to find the running instance of Jupyter and its login token. A quick way to do so in a single command, is:
- Save the domain name in a
K8S_DOMAINenvironment variable - Run the “
jupyter notebook list” command inside the active Jupyter pod and construct a correct login URL like this:
kubectl exec $(kubectl get pods -l app.kubernetes.io/instance=my-pyspark-notebook -o go-template --template '{{(index .items 0).metadata.name}}') jupyter notebook list \
    | grep 'http://0.0.0.0:8888/' \
    | awk '{print $1}' \
    | sed "s|http://0.0.0.0:8888|https://$K8S_DOMAIN|"
This command does three things:
- Finds the name of a needed pod,
- Executes the command “jupyter notebook list” to see active Jupyter sessions and their tokens,
- Substitutes the generic localhost address to your custom domain name, to get a proper link with a token.
Open this URL in a web browser. To avoid possible DNS caching issues, wait a couple of minutes before opening the Jupyter Notebook.
Running Spark workloads
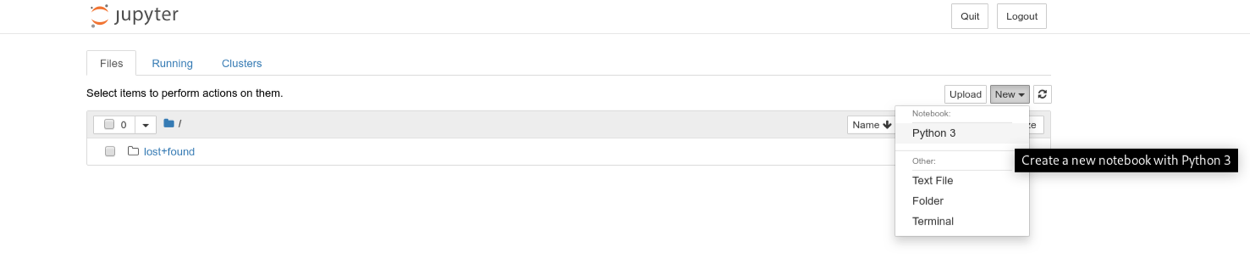
Create a Python 3 notebook in Jupyter by clicking “New” -> “Python 3”:
Create a Spark context and pay attention to the highlighted code comments to understand what each part of the example does. We used a “#”, you can still just copy paste all of the code below into the UI and run it:
import pyspark
# After we imported the package,
# create the SparkConf object for configuration:
conf = pyspark.SparkConf()
# Kubernetes is a Spark master in our setup.
# It creates pods with Spark workers, orchestrates those
# workers and returns final results to the Spark driver
# (“k8s://https://” is NOT a typo, this is how Spark knows the “provider” type).
conf.setMaster("k8s://https://kubernetes.default.svc.cluster.local:443")
# Worker pods are created from this docker image.
# If you use another image, specify its name instead.
conf.set("spark.kubernetes.container.image", "kublr/spark-py:2.4.0-hadoop-2.6")
# Authentication (required to create worker pods):
conf.set("spark.kubernetes.authenticate.caCertFile", "/var/run/secrets/kubernetes.io/serviceaccount/ca.crt")
conf.set("spark.kubernetes.authenticate.oauthTokenFile", "/var/run/secrets/kubernetes.io/serviceaccount/token")
# Replace `my-pyspark-notebook` by the actual name
# of the Jupyter release in Helm (run “helm list” to see releases):
conf.set("spark.kubernetes.authenticate.driver.serviceAccountName", "my-pyspark-notebook")
# 2 pods/workers will be created. Customize it if necessary.
conf.set("spark.executor.instances", "2")
# Below, the DNS alias for the Spark driver come in handy.
# Replace `my-pyspark-notebook` by the release name, again:
conf.set("spark.driver.host", "my-pyspark-notebook-spark-driver.default.svc.cluster.local")
# Next we set the port. You are free to use another number.
# If this port is busy, spark-shell tries to bind to another port.
conf.set("spark.driver.port", "29413")
# And last, we create the SparkContext and pass it the config object,
# to launch the workers!
sc = pyspark.SparkContext(conf=conf)
As a result, two Spark worker pods should be created:
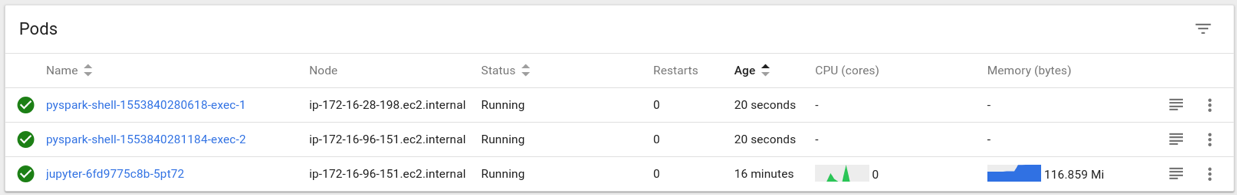
The first time, the worker pod creation may take a few seconds while Kubernetes downloads the Docker image to the hosts on which it will run.
Now you can calculate something on the Spark cluster, for example:
rdd = sc.parallelize(range(100000000))
rdd.sum()
It should return 4999999950000000. If it works, you know that Spark is operational.
To ensure that all pods have participated in the calculation, we can read their logs. Execute a ‘kubectl logs’ command to these pods, or just open their logs in the Kubernetes dashboard. Here is an example where we can see that both pods (‘…exec-1’ and ‘…exec-2’) participated in this calculation:
pyspark-shell-1553840280618-exec-1:
2019-03-29 06:21:38 INFO CoarseGrainedExecutorBackend:54 - Got assigned task 0
2019-03-29 06:21:38 INFO Executor:54 - Running task 0.0 in stage 0.0 (TID 0)
2019-03-29 06:21:38 INFO TorrentBroadcast:54 - Started reading broadcast variable 0
2019-03-29 06:21:38 INFO TransportClientFactory:267 - Successfully created connection to my-pyspark-notebook-spark-driver.default.svc.cluster.local/100.96.0.10:40161 after 2 ms (0 ms spent in bootstraps)
2019-03-29 06:21:38 INFO MemoryStore:54 - Block broadcast_0_piece0 stored as bytes in memory (estimated size 3.9 KB, free 413.9 MB)
2019-03-29 06:21:38 INFO TorrentBroadcast:54 - Reading broadcast variable 0 took 119 ms
2019-03-29 06:21:38 INFO MemoryStore:54 - Block broadcast_0 stored as values in memory (estimated size 5.7 KB, free 413.9 MB)
2019-03-29 06:21:40 INFO PythonRunner:54 - Times: total = 2137, boot = 452, init = 51, finish = 1634
2019-03-29 06:21:40 INFO Executor:54 - Finished task 0.0 in stage 0.0 (TID 0). 1468 bytes result sent to driver
pyspark-shell-1553840281184-exec-2:
2019-03-29 06:21:38 INFO CoarseGrainedExecutorBackend:54 - Got assigned task 1
2019-03-29 06:21:38 INFO Executor:54 - Running task 1.0 in stage 0.0 (TID 1)
2019-03-29 06:21:38 INFO TorrentBroadcast:54 - Started reading broadcast variable 0
2019-03-29 06:21:38 INFO TransportClientFactory:267 - Successfully created connection to my-pyspark-notebook-spark-driver.default.svc.cluster.local/100.96.0.10:40161 after 1 ms (0 ms spent in bootstraps)
2019-03-29 06:21:38 INFO MemoryStore:54 - Block broadcast_0_piece0 stored as bytes in memory (estimated size 3.9 KB, free 413.9 MB)
2019-03-29 06:21:38 INFO TorrentBroadcast:54 - Reading broadcast variable 0 took 115 ms
2019-03-29 06:21:38 INFO MemoryStore:54 - Block broadcast_0 stored as values in memory (estimated size 5.7 KB, free 413.9 MB)
2019-03-29 06:21:40 INFO PythonRunner:54 - Times: total = 2108, boot = 433, init = 52, finish = 1623
2019-03-29 06:21:40 INFO Executor:54 - Finished task 1.0 in stage 0.0 (TID 1). 1425 bytes result sent to driver
Also, it’s a good practice to clean up the resources. You can do that by running: sc.stop()
This command deletes the worker pods with the same effect as shutting down the notebook kernel.
Deploy HDFS to Kubernetes cluster
To speed up the data processing, deploy the Hadoop Distributed File System to this cluster. The architecture of HDFS allows high throughput and faster “seek” to the required chunks of data for the data to be processed on the same node where it resides on the disk.
While the description of that mechanism is out of scope of this article, you can read more about the benefits of this architecture here.
For your convenience, the HDFS on Kubernetes project contains a ready-to-use Helm chart to deploy HDFS on a Kubernetes cluster.
Default setup includes:
- 2 namenodes, 1 active and 1 standby, with 100 GB volume each
- 4 datanodes
- 3 journalnodes with 20 GB volume each
- 3 zookeeper servers (to make sure only one namenode is active) with 5 GB volume each
- HDFS client pod
To deploy it, clone the example repo, and switch to that folder:
git clone https://github.com/apache-spark-on-k8s/kubernetes-HDFS.git
cd kubernetes-HDFS
To get access to HDFS Web UI later, you’ll need to edit the properties dfs.namenode.http-address.hdfs-k8s.nn0 and dfs.namenode.http-address.hdfs-k8s.nn1 in this file “charts/hdfs-config-k8s/templates/configmap. yaml“, like this:
<property>
    <name>dfs.namenode.http-address.hdfs-k8s.nn0</name>
    <value>0.0.0.0:50070</value>
</property>
<property>
    <name>dfs.namenode.http-address.hdfs-k8s.nn1</name>
    <value>0.0.0.0:50070</value>
</property>
Here we duplicate required commands to set up HDFS, but they may become outdated, so see the origin for the latest version.
helm repo add incubator  \
      https://kubernetes-charts-incubator.storage.googleapis.com/
helm dependency build charts/hdfs-k8s
helm install -n my-hdfs charts/hdfs-k8s
We use a default release name my-hdfs, but you don’t have to. If you use another name, substitute it when following this guide chapter.
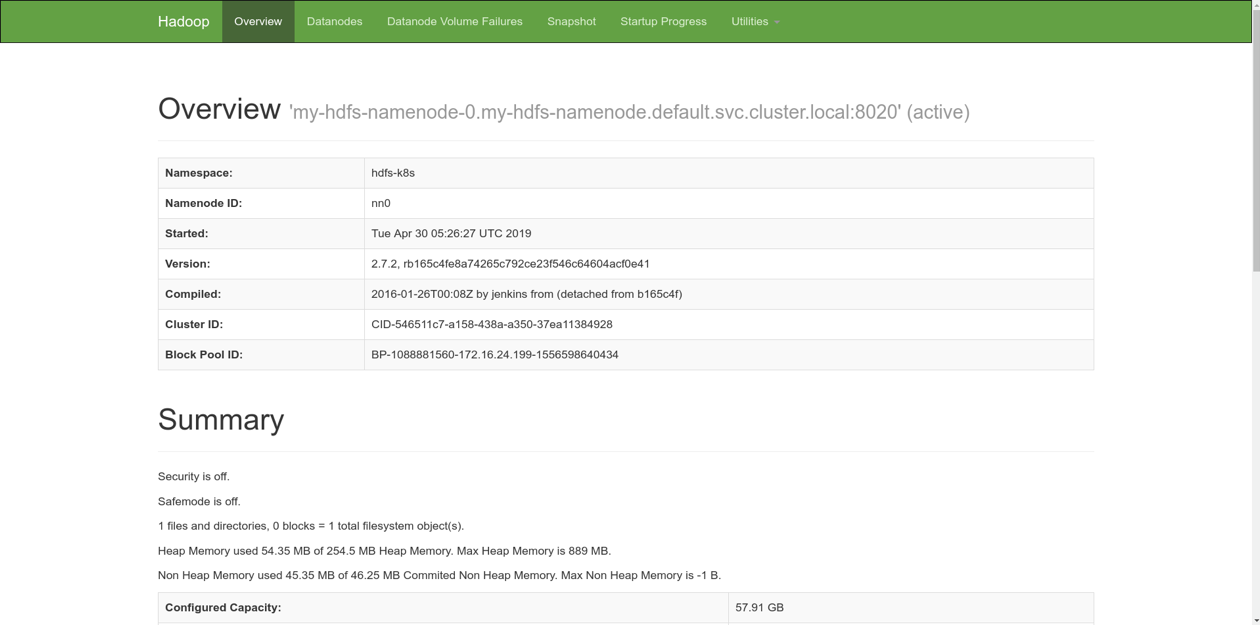
When the Helm release is installed, some pods, config maps, daemon sets, and other resources are created. While a detailed description of all of them isn’t covered here, you can find that information online. The entire process may take some time as temporary errors like pod has unbound immediate PersistentVolumeClaims and/or auto-scaling. When everything is ready, you should have access to the HDFS Web UI using port forwarding:
kubectl port-forward service/my-hdfs-namenode 50070:50070
Then the UI becomes available at http://localhost:50070. You can see the current status of the system by navigating there.
Now we want to create a new Spark session:
from pyspark.sql import SparkSession
sparkSession = SparkSession.builder \
    .master("k8s://https://kubernetes.default.svc.cluster.local:443") \
    .config("spark.kubernetes.container.image", "kublr/spark-py:2.4.0-hadoop-2.6") \
    .config("spark.kubernetes.authenticate.caCertFile", "/var/run/secrets/kubernetes.io/serviceaccount/ca.crt") \
    .config("spark.kubernetes.authenticate.oauthTokenFile", "/var/run/secrets/kubernetes.io/serviceaccount/token") \
    .config("spark.kubernetes.authenticate.driver.serviceAccountName", "my-pyspark-notebook") \
    .config("spark.executor.instances", "2") \
    .config("spark.driver.host", "my-pyspark-notebook-spark-driver.default.svc.cluster.local") \
    .config("spark.driver.port", "29413") \
    .getOrCreate()
sc = sparkSession.sparkContext
Describe some data:
df = sparkSession.createDataFrame(sc.parallelize(range(10000000)).map(lambda i: ((i, i * 2))))
Hereafter, we will execute HDFS commands from a dedicated pod created by helm install along with others. Here we obtain its name:
_CLIENT=$(kubectl get pods -l app=hdfs-client,release=my-hdfs -o name | cut -d/ -f 2)
If you’ve deployed HDFS as described above, there should be 2 name nodes. Let’s check them:
kubectl exec $_CLIENT -- hdfs haadmin -getServiceState nn0
It prints active. Well, how about another?
kubectl exec $_CLIENT -- hdfs haadmin -getServiceState nn1
Output: standby.
This means, we have one active master and one replica in standby mode. Let’s save our data as a CSV file on HDFS. We have to use the hostname of the master to do it, because nodes in standby mode cannot accept write requests.
df.write.csv("hdfs://my-hdfs-namenode-0.my-hdfs-namenode.default.svc.cluster.local/user/hdfs/test/example.csv")
Through the Spark worker pod logs, we can ensure that all pods participated in the calculation and writing:
pyspark-shell-1554099778487-exec-1:
2019-04-01 06:25:27 INFO CoarseGrainedExecutorBackend:54 - Got assigned task 2
2019-04-01 06:25:27 INFO Executor:54 - Running task 1.0 in stage 1.0 (TID 2)
2019-04-01 06:25:27 INFO TorrentBroadcast:54 - Started reading broadcast variable 1
2019-04-01 06:25:27 INFO MemoryStore:54 - Block broadcast_1_piece0 stored as bytes in memory (estimated size 53.4 KB, free 413.9 MB)
2019-04-01 06:25:27 INFO TorrentBroadcast:54 - Reading broadcast variable 1 took 18 ms
2019-04-01 06:25:27 INFO MemoryStore:54 - Block broadcast_1 stored as values in memory (estimated size 141.1 KB, free 413.7 MB)
2019-04-01 06:25:28 INFO CodeGenerator:54 - Code generated in 214.957469 ms
2019-04-01 06:25:28 INFO SQLHadoopMapReduceCommitProtocol:54 - Using output committer class org.apache.hadoop.mapreduce.lib.output.FileOutputCommitter
2019-04-01 06:25:46 INFO PythonRunner:54 - Times: total = 19412, boot = 8, init = 42, finish = 19362
2019-04-01 06:25:47 INFO FileOutputCommitter:439 - Saved output of task 'attempt_20190401062528_0001_m_000001_0' to hdfs://my-hdfs-namenode-0.my-hdfs-namenode.default.svc.cluster.local/user/hdfs/test/example.csv/_temporary/0/task_20190401062528_0001_m_000001
2019-04-01 06:25:47 INFO SparkHadoopMapRedUtil:54 - attempt_20190401062528_0001_m_000001_0: Committed
2019-04-01 06:25:47 INFO Executor:54 - Finished task 1.0 in stage 1.0 (TID 2). 2727 bytes result sent to driver
pyspark-shell-1554099779266-exec-2:
2019-04-01 06:25:27 INFO CoarseGrainedExecutorBackend:54 - Got assigned task 1
2019-04-01 06:25:27 INFO Executor:54 - Running task 0.0 in stage 1.0 (TID 1)
2019-04-01 06:25:27 INFO TorrentBroadcast:54 - Started reading broadcast variable 1
2019-04-01 06:25:27 INFO TransportClientFactory:267 - Successfully created connection to /100.96.3.8:35072 after 2 ms (0 ms spent in bootstraps)
2019-04-01 06:25:27 INFO MemoryStore:54 - Block broadcast_1_piece0 stored as bytes in memory (estimated size 53.4 KB, free 413.9 MB)
2019-04-01 06:25:27 INFO TorrentBroadcast:54 - Reading broadcast variable 1 took 127 ms
2019-04-01 06:25:27 INFO MemoryStore:54 - Block broadcast_1 stored as values in memory (estimated size 141.1 KB, free 413.7 MB)
2019-04-01 06:25:28 INFO CodeGenerator:54 - Code generated in 291.154539 ms
2019-04-01 06:25:29 INFO SQLHadoopMapReduceCommitProtocol:54 - Using output committer class org.apache.hadoop.mapreduce.lib.output.FileOutputCommitter
2019-04-01 06:25:47 INFO PythonRunner:54 - Times: total = 19679, boot = 411, init = 52, finish = 19216
2019-04-01 06:25:47 INFO FileOutputCommitter:439 - Saved output of task 'attempt_20190401062528_0001_m_000000_0' to hdfs://my-hdfs-namenode-0.my-hdfs-namenode.default.svc.cluster.local/user/hdfs/test/example.csv/_temporary/0/task_20190401062528_0001_m_000000
2019-04-01 06:25:47 INFO SparkHadoopMapRedUtil:54 - attempt_20190401062528_0001_m_000000_0: Committed
2019-04-01 06:25:47 INFO Executor:54 - Finished task 0.0 in stage 1.0 (TID 1). 2727 bytes result sent to driver
Let’s review the file in HDFS:
kubectl exec $_CLIENT -- hdfs dfs -ls /user/hdfs/test/example.csv
It should print something like
Found 3 items
-rw-r--r-- 3 root supergroup 0 2019-04-01 06:25 /user/hdfs/test/example.csv/_SUCCESS
-rw-r--r-- 3 root supergroup 78333335 2019-04-01 06:25 /user/hdfs/test/example.csv/part-00000-8de1982a-d9f9-4632-82bc-2f623b6b51ca-c000.csv
-rw-r--r-- 3 root supergroup 85000000 2019-04-01 06:25 /user/hdfs/test/example.csv/part-00001-8de1982a-d9f9-4632-82bc-2f623b6b51ca-c000.csv
As we can see, it consists of 2 parts, one for each Spark worker.
Now let’s read the file (we should see “10000000” printed) so the pods read it:
sparkSession.read.csv("hdfs://my-hdfs-namenode-0.my-hdfs-namenode.default.svc.cluster.local/user/hdfs/test/example.csv").count()
Reading is performed also on both Spark pods, we can see it now:
pyspark-shell-1554099778487-exec-1:

019-04-01 08:37:41 INFO CoarseGrainedExecutorBackend:54 - Got assigned task 4
2019-04-01 08:37:41 INFO Executor:54 - Running task 0.0 in stage 3.0 (TID 4)
2019-04-01 08:37:41 INFO TorrentBroadcast:54 - Started reading broadcast variable 6
2019-04-01 08:37:41 INFO TransportClientFactory:267 - Successfully created connection to /100.96.2.12:32964 after 2 ms (0 ms spent in bootstraps)
2019-04-01 08:37:41 INFO MemoryStore:54 - Block broadcast_6_piece0 stored as bytes in memory (estimated size 6.5 KB, free 413.9 MB)
2019-04-01 08:37:41 INFO TorrentBroadcast:54 - Reading broadcast variable 6 took 55 ms
2019-04-01 08:37:41 INFO MemoryStore:54 - Block broadcast_6 stored as values in memory (estimated size 12.3 KB, free 413.9 MB)
2019-04-01 08:37:41 INFO CodeGenerator:54 - Code generated in 22.953308 ms
2019-04-01 08:37:41 INFO FileScanRDD:54 - Reading File path: hdfs://my-hdfs-namenode-0.my-hdfs-namenode.default.svc.cluster.local/user/hdfs/test/example.csv/part-00001-8de1982a-d9f9-4632-82bc-2f623b6b51ca-c000.csv, range: 0-85000000, partition values: [empty row]
2019-04-01 08:37:41 INFO CodeGenerator:54 - Code generated in 6.817728 ms
2019-04-01 08:37:41 INFO TorrentBroadcast:54 - Started reading broadcast variable 5
2019-04-01 08:37:41 INFO MemoryStore:54 - Block broadcast_5_piece0 stored as bytes in memory (estimated size 20.9 KB, free 413.9 MB)
2019-04-01 08:37:41 INFO TorrentBroadcast:54 - Reading broadcast variable 5 took 9 ms
2019-04-01 08:37:41 INFO MemoryStore:54 - Block broadcast_5 stored as values in memory (estimated size 296.3 KB, free 413.6 MB)
2019-04-01 08:37:42 INFO Executor:54 - Finished task 0.0 in stage 3.0 (TID 4). 1624 bytes result sent to driver
pyspark-shell-1554099779266-exec-2:
2019-04-01 08:37:41 INFO Executor:54 - Running task 1.0 in stage 3.0 (TID 5)
2019-04-01 08:37:41 INFO TorrentBroadcast:54 - Started reading broadcast variable 6
2019-04-01 08:37:41 INFO MemoryStore:54 - Block broadcast_6_piece0 stored as bytes in memory (estimated size 6.5 KB, free 413.9 MB)
2019-04-01 08:37:41 INFO TorrentBroadcast:54 - Reading broadcast variable 6 took 7 ms
2019-04-01 08:37:41 INFO MemoryStore:54 - Block broadcast_6 stored as values in memory (estimated size 12.3 KB, free 413.9 MB)
2019-04-01 08:37:41 INFO CodeGenerator:54 - Code generated in 20.519085 ms
2019-04-01 08:37:41 INFO FileScanRDD:54 - Reading File path: hdfs://my-hdfs-namenode-0.my-hdfs-namenode.default.svc.cluster.local/user/hdfs/test/example.csv/part-00000-8de1982a-d9f9-4632-82bc-2f623b6b51ca-c000.csv, range: 0-78333335, partition values: [empty row]
2019-04-01 08:37:41 INFO CodeGenerator:54 - Code generated in 14.180708 ms
2019-04-01 08:37:41 INFO TorrentBroadcast:54 - Started reading broadcast variable 5
2019-04-01 08:37:41 INFO MemoryStore:54 - Block broadcast_5_piece0 stored as bytes in memory (estimated size 20.9 KB, free 413.9 MB)
2019-04-01 08:37:41 INFO TorrentBroadcast:54 - Reading broadcast variable 5 took 20 ms
2019-04-01 08:37:41 INFO MemoryStore:54 - Block broadcast_5 stored as values in memory (estimated size 296.3 KB, free 413.6 MB)
2019-04-01 08:37:42 INFO Executor:54 - Finished task 1.0 in stage 3.0 (TID 5). 1668 bytes result sent to driver
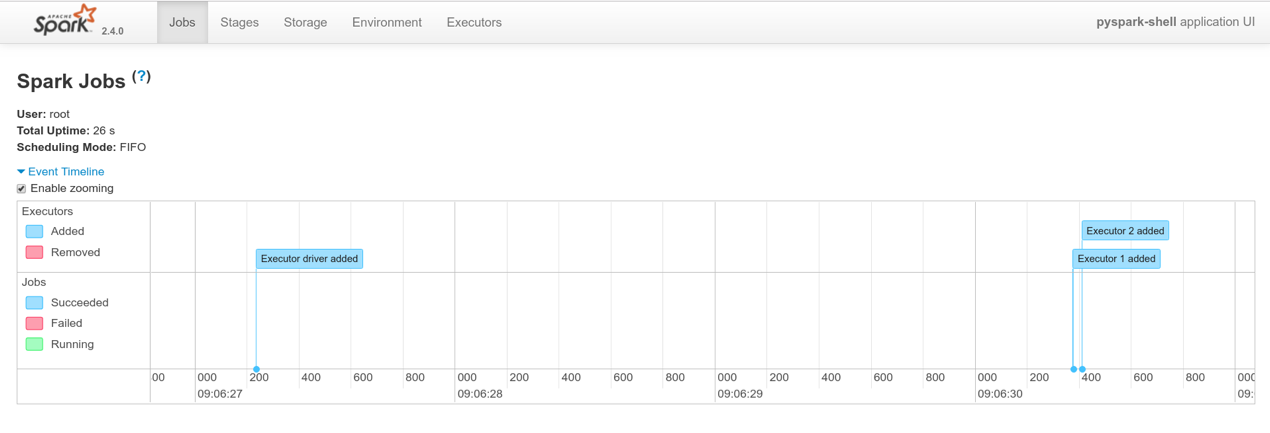
Accessing the Spark web UI
You also have the option to open access to the Spark UI by starting a Kubernetes Proxy in your terminal:
kubectl proxy
and then observe Spark at
http://localhost:8001/api/v1/namespaces/default/services/my-pyspark-notebook-spark-ui:4040/proxy/ (replace `my-pyspark-notebook` by the actual name of the Jupyter release).
This is a quick hack for local development and testing purposes (accessing a service in Kubernetes cluster using the kube proxy). If you would like to expose these dashboards to others, you should set up a proper ingress rule and point a domain name to that ingress controller address.
Resource requests and limits for Spark pods
Pod memory and CPU consumption limits and requests, are set during the Spark context creation and cannot be modified later. By default, they are set to 1408Mi and 1 CPU respectively.
To customize the CPU limit, set
spark.kubernetes.executor.limit.cores
``` .
Example: `conf.set("spark.kubernetes.executor.limit.cores", "2")`

To customize the CPU request values, set `spark.kubernetes.executor.request.cores`.\
Example: `conf.set("spark.kubernetes.executor.request.cores", "0.5")`

Memory request and limit cannot be configured separately. To customize them, set `spark.executor.memory`:\
Example: `conf.set("spark.executor.memory", "2g")`

### Kubernetes Cluster Auto-Scaling

At this point, we have finally approached the most exciting feature setup! When Kubernetes demands more resources for its Spark worker pods, the Kubernetes cluster auto scaler will take care of underlying infrastructure provider scaling automatically.

Let’s create a Spark context with more executors:

```java
import pyspark
conf = pyspark.SparkConf()
conf.setMaster("k8s://https://kubernetes.default.svc.cluster.local:443")
conf.set("spark.kubernetes.container.image", "kublr/spark-py:2.4.0-hadoop-2.6")

conf.set("spark.kubernetes.authenticate.caCertFile", "/var/run/secrets/kubernetes.io/serviceaccount/ca.crt")
conf.set("spark.kubernetes.authenticate.oauthTokenFile", "/var/run/secrets/kubernetes.io/serviceaccount/token")
conf.set("spark.kubernetes.authenticate.driver.serviceAccountName", "my-pyspark-notebook")

conf.set("spark.executor.instances", "10")
conf.set("spark.driver.host", "my-pyspark-notebook-spark-driver.default.svc.cluster.local")
conf.set("spark.driver.port", "29413")
sc = pyspark.SparkContext(conf=conf)
Some pods are out of resources because there are not enough Kubernetes worker nodes to accommodate all of these pods, so they cannot start:
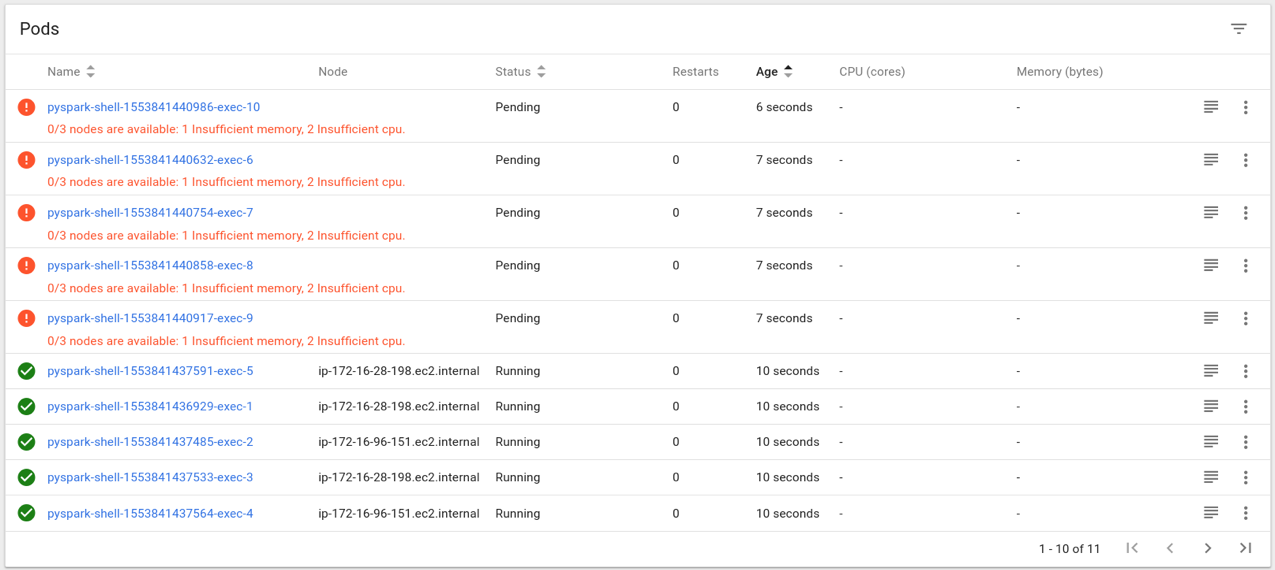
Don’t panic! We configured the cluster so it autoscales, remember? Give it five to ten minutes for Kublr and Kubernetes to create more nodes.
Here they are:
Finally, all pods are up and running! Now let’s say we have completed the calculations and want to close the Spark contexts and release resources, execute: sc.stop()
Since the additional nodes aren’t needed, the autoscaler will down-scale the cluster. This will also take about 10 minutes.
If you used Spotinst when creating the cluster, your savings are even higher. Kublr’s Spotinst integration ensures that each time these workloads are spawned, Spotinst identifies additional resource requirements and asks for more machines. Spotinst will place the bids using their price prediction algorithms. They are able to bib quite precisely resulting in rapid retrieval of the needed VM instance. The potential savings can be huge, while the time it takes to scale out is short to non-existent.
Spot instances on AWS are perfect for short-term workloads like these Spark workers (by short-term we mean hours to days). We’ve seen spot instances run continuously during weeks, sometimes even months — it all depends on instance size. Some instances have higher demand while others have lower. Those instance sizes with low demand by the general public may keep running for months before they get their termination signal. For hourly load spikes, it’s a no brainer. There are only benefits and nothing to lose. That is, as long as we’re talking about stateless applications, where we can easily add new machines and terminate old ones with no risk to data.
Spark and other similar heavy, but short term processing operations are a perfect example of a workload type that’s suitable for autoscaling. Kublr simplifies setup and operations of multiple clusters across clouds distributed across different regions from one single pane of glass. Try it yourself! Download Kublr — it’s free for dev and QA!