
Centralized logging is an important component of any production-grade infrastructure, but it is especially critical in a containerized architecture. If you’re using Kubernetes to run your workloads, there’s no easy way to find the correct log “files” on one of the many worker nodes in your cluster. Kubernetes will reschedule your pods between different physical servers or cloud instances. Pod logs can be lost or, if a pod crashes, the logs may also get deleted from disk. Without a centralized logging solution, it is practically impossible to find a particular log file located somewhere on one of the hundreds or thousands of worker nodes. For this reason, any production-grade cluster should have its log collector agents configured on all nodes and use a centralized storage such as CloudWatch, S3, or Elasticsearch for all log data.

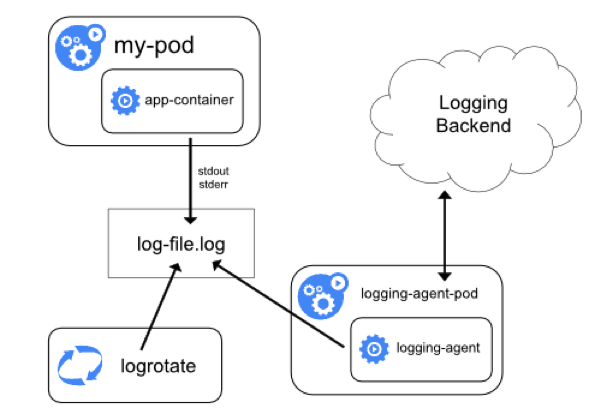
Analyzing log data can help in debugging issues with your deployed applications and services, such as determining the reason for container termination or application crash. When using the EFK Kubernetes logging solution (which is Elasticsearch, FluentD, and Kibana), all an application typically needs to do is print messages to stdout and stderr. The Docker engine will take care of putting these messages into JSON log files on the running node. The log collector agent (fluentd or logstash are popular options) will send each log line as a separate message to Elasticsearch or CloudWatch, so you can examine and analyze all messages from your containers, including Kubernetes core components such as etcd or kube-apiserver.
There are several options to set up centralized logging. One of the best solutions is to establish one logging agent per Kubernetes node to collect all logs of all running containers from disk and transmit these to either Elasticsearch, CloudWatch, or both at the same time (a good option available in Kublr with fluentd).
When a log collector reads a message, it parses and sorts or filters the results — creating new fields or removing fields — before sending to target storage. You have full control over how your final log data will be presented in Elasticsearch or CloudWatch. Both fluentd and logstash have sophisticated parsers and plugins to allow you to easily manipulate the message text without writing a regex for parsing a JSON string because you have JSON parsing built in.

Another important use case for centralized logging is alerting based on detected anomalies such as a sudden drop in traffic volume or an unusual increase in error messages from a particular service in your cluster. Let’s say you have a complex internal ETL-type service that has no simple health check like “up/down”. This service has failed, but nothing was logged and it didn’t crash. Instead, maybe the service got stuck in a loop or skipped its intended operation, such as sorting data and loading data to the database. This failure might go unnoticed for some time because the basic health check that verifies if the service is “operational” or “down” passes and sees the service as active, despite the failure to complete some of its critical actions.
Sometimes health checks aren’t enough to determine if the service is running correctly. In this case, other dependent services which are clients of the faulty service will report the error in their log files. Properly configured cluster-wide alerting based on error frequency anomaly (a “spike” or “percentage” of error messages vs usual output message rate) will use these logs to trigger alerts. The dependent service will not be able to make successful requests (i.e. find the expected data, get expected result) and will start logging an error message each time. Such situations will trigger alerts to notify the SRE team (Site Reliability Engineering) and start resolving the issue before it affects more clients.
Structured logging, which we will use in our tutorial, means that your applications should output all (or at least most) of their log messages in a structured format like JSON or XML. You will usually see JSON as the log format in modern open-source applications. It can be parsed easily, and you can search the logs later based on a particular field value instead of free text. This allows us to create dashboards for BI or analytics teams, and fetch precise aggregated results on-demand for use in periodic reports (for example, number of clients from each country who accessed a service last month or determining the most frequent cause of application crashes to help prioritize).
It is also useful to add extra fields of information when an exception is handled in your application to help you understand the exact combination of events that led to this exception. These fields can include active user, amount of data to be processed, critical variables, or even current server stats like free memory. If you use structured logging, you will be able to see the related fields easily in the same “message”. If unstructured logging is used and ingested to Elasticsearch as line-by-line messages, you will struggle to find related “lines” by searching first for the error itself, and only then searching for the approximate timeframe of error occurrence in order to see a few lines “before” and “after” the exception to find those details.
Another advantage of structured logging versus unstructured or plain-text logs is Elasticsearch performance during querying. When you have many large plain-text messages, the query will take longer to complete than a query by separate field terms, and the results will not be suitable for a dashboard graph or chart. Using structured logging is also critical for ElastAlert, because if one or more free-text queries are run periodically in ElastAlert (especially when you create many alert rules) it will put an unnecessary extra load on the Elasticsearch cluster.
As a prerequisite to the following tutorial, you will need a running Kubernetes cluster with a configured EFK stack. You can get this set up and running on AWS using Kublr in a few minutes. Kublr provides you with an easy installation of all required components, including Elasticsearch, fluentd, and Kibana.
Let’s start with the deployment of our example microservice, which is a simple dockerized application that writes different types of log messages on a regular basis. This will provide us with good example data to use in this tutorial. The messages will contain the log level (INFO / WARN / ERROR) and the event message. We have a few dummy events pre-configured in this application, so it will throw errors and warnings from time to time. We’ll be able to analyze and visualize the logs in Kibana.
Our containers send logs in JSON format. One line of JSON is one message from our service that will be picked up by fluentd from the default docker log location on worker nodes. The message is sent to Elasticsearch with the addition of special meta tags that help identify and separate fluentd logs from any other messages you might want to send to Elasticsearch from other sources.
Before deploying the demo logger containers, we will modify the fluentd configuration in our Kubernetes setup to make it familiar with the automatic JSON parsing that we mentioned earlier. By default, fluentd will send each log file text line as a field named “log”, adding other fields to the message automatically (for example, “tag” to identify the container and “stream” to identify stdout or stderr).
The result looks like this in Kibana:
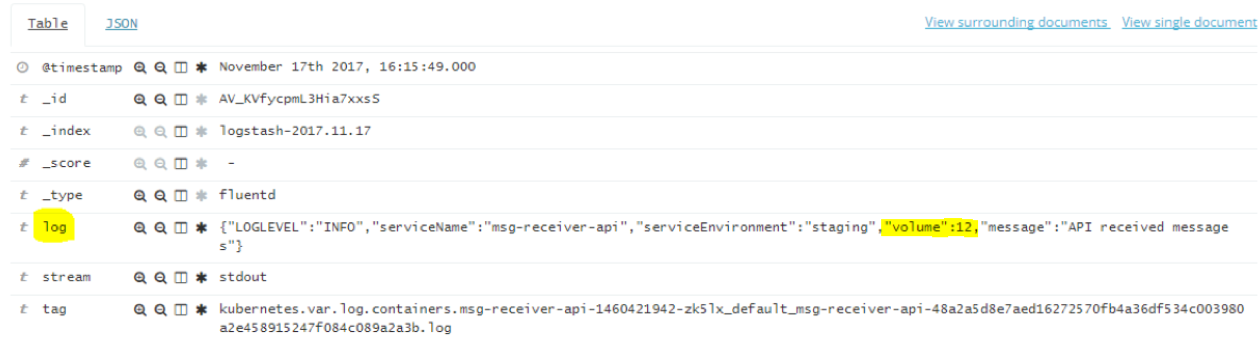
This is not how we want our fields displayed in a final message. To properly analyze and visualize our events, we must separate each field from the JSON message into its own field, ensuring that a number will be parsed to a number field, and so on. Note the “volume”:12 in this example JSON message: if this number is not a numeric field of its own in Elasticsearch, we will not be able to aggregate and count these in a histogram.
Let’s look at an example result that we do want to see after fluentd parses the JSON for us and extracts all its fields:
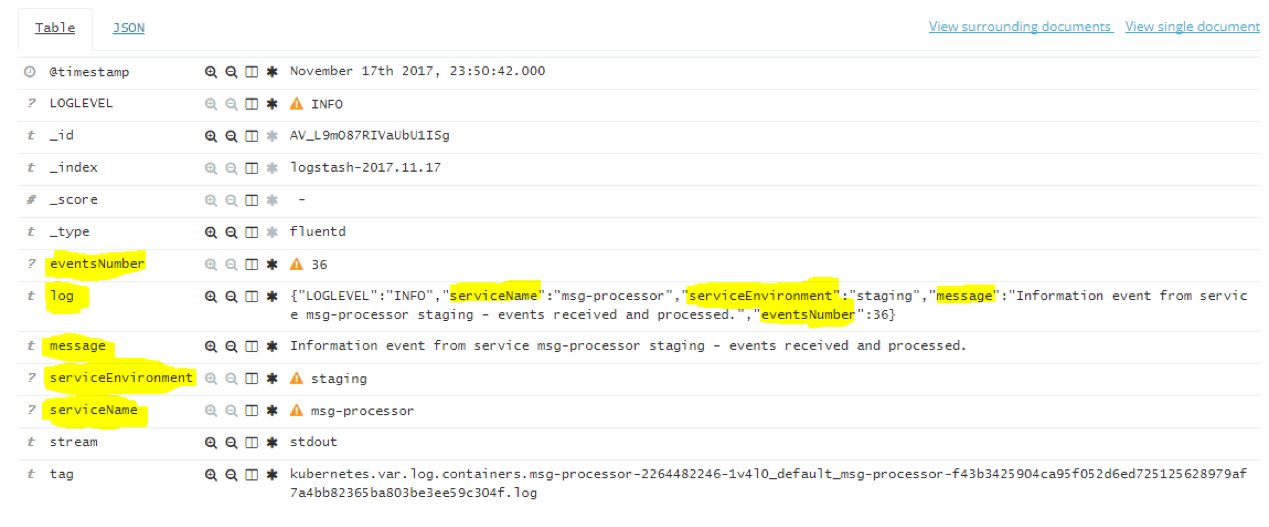
Note how the “log” field was parsed into: message, eventsNumber, serviceEnvironment, and serviceName. Now we can separate the messages of each service by name, count which one had the most events, compare to other services and events, and visualize for reporting.
The orange alert indicator indicates we didn’t refresh our index field list in Kibana after adding the fluentd rule of JSON parsing. As a result, new fields not familiar to Kibana appeared. If this occurs after you modify fluentd config with new parsers and filters, you can resolve the alert by navigating to “Management” -> ”Index Patterns” and clicking “Refresh field list”.
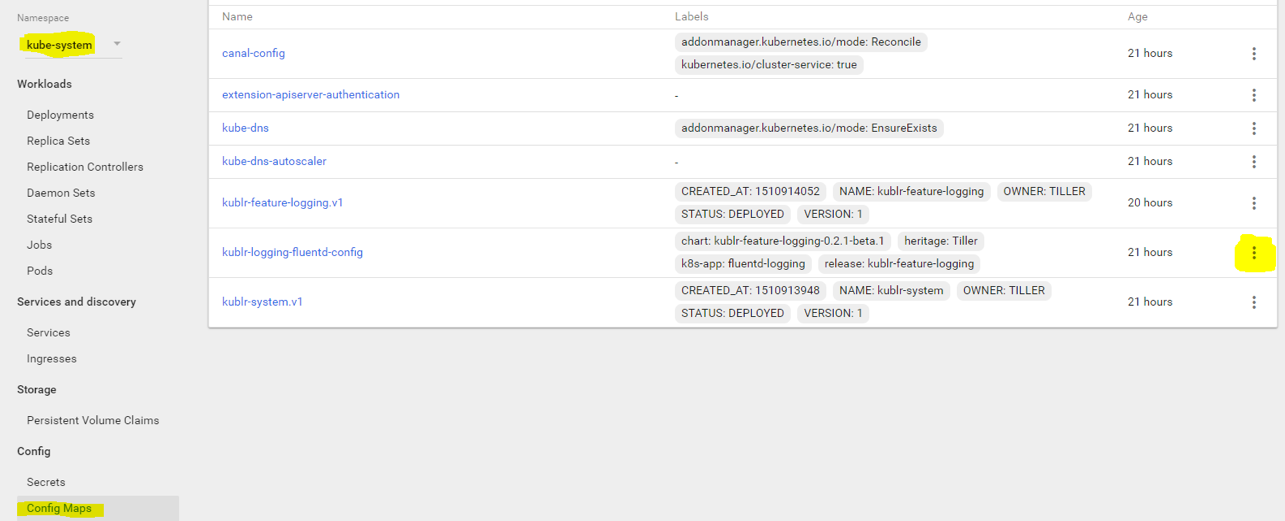
Before we deploy our dummy logger containers, we must modify our fluentd agent configuration by adding a JSON parser to extract new fields from the “log” field. Open the Kubernetes dashboard, switch to “kube-system” namespace, select “config maps”, and click edit to the right of “kublr-logging-fluentd-config”.
You will see the YAML editor of the config map. Scroll to the bottom to see the config file in the “data.td-agent-kublr.conf” field. It looks odd because the YAML editor doesn’t show new lines in that value field. Instead, we have “\n” characters. However, this isn’t an issue because we can see a better representation of the config if we click on the config map name itself instead (vs editing it). We’ll do this later, after adding our filter, to verify it worked.
We need to add the following filter:
<filter **>\n
    @type parser \n
    format json \n
    time_parse false \n
    suppress_parse_error_log true \n
    ignore_key_not_exist true \n
    key_name log \n
    reserve_data true \n
</filter>\n
Paste it between the first tag and the next <match **> tag:
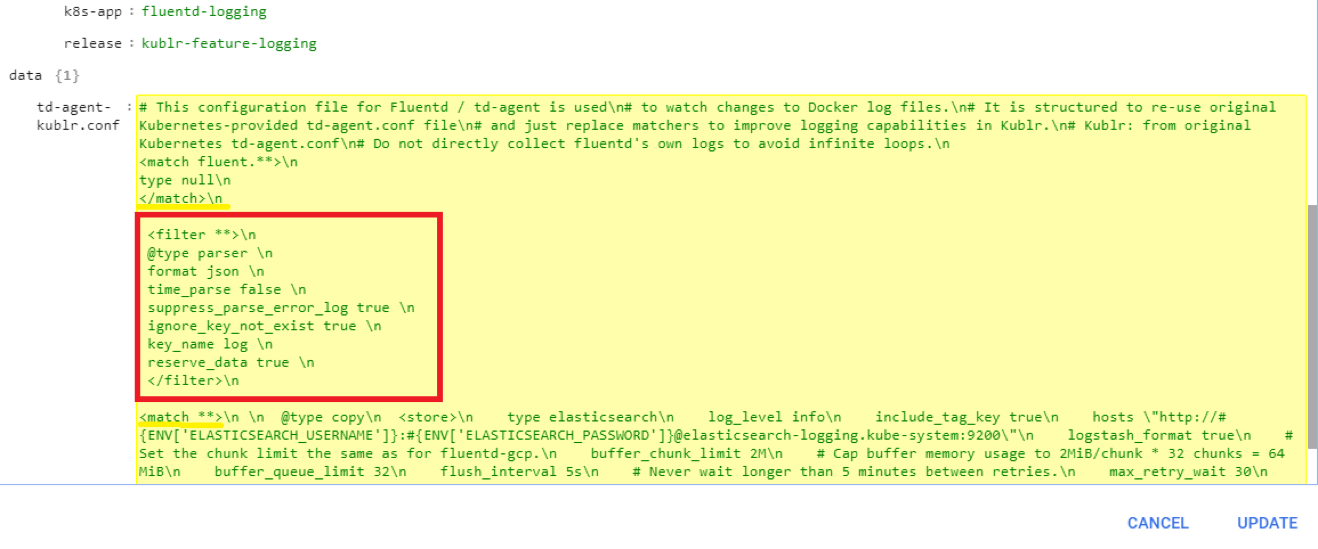
Select “Update” to save. Click the config map name to open the Details page and view our properly placed filter:
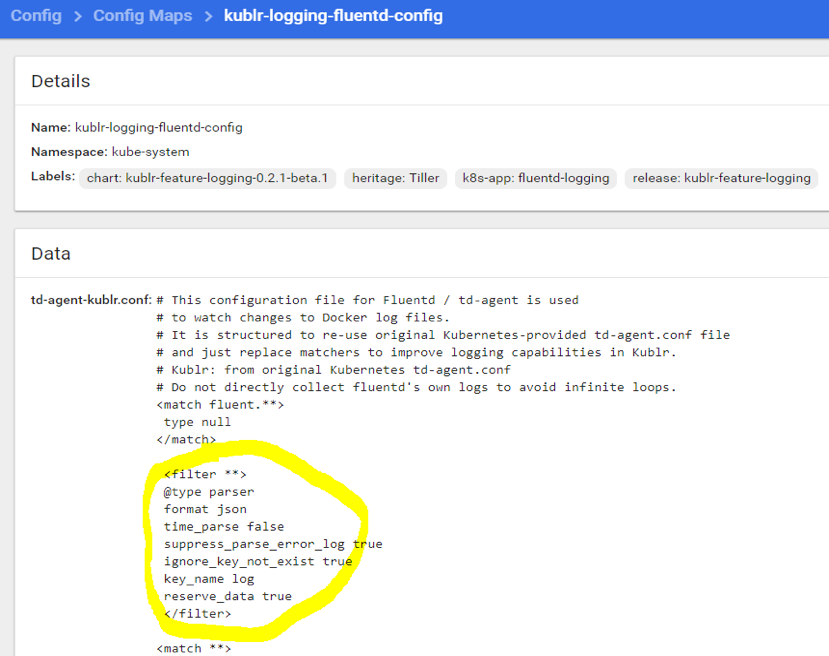
The filter configures fluentd to get any field named “log” in any received message and attempt to parse it as JSON, ignoring errors if the field doesn’t exist or contains formatting other than valid JSON. To throw an error on invalid JSON, switch suppress_parse_error_log to false.
Next, we must restart our fluentd collectors that are controlled by the daemon set of fluentd. If the DaemonSet was a “deployment” resource (pod replication) and not a “daemon set” (one pod per worker node), we could set the replica number to 0, wait for their termination, and put the original number of replicas back to refresh our pods. However, there’s no such option in daemon set because it maintains 1 container per worker node. So, we must manually terminate running fluentd collectors. The collectors will instantly come back with the new config that we modified. To terminate the collectors, navigate to “pods” and select “delete” on each of your fluentd pods:
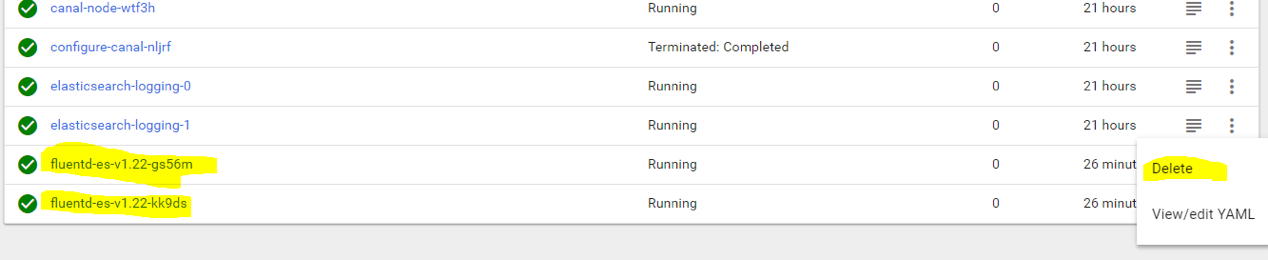
After 10–15 seconds, the new pods will be up and running with a new config. We are now ready to deploy our demo containers that will log JSON lines to stdout. You have two options to create the deployment: use CLI command “kubectl”, or use the web UI.
To create the deployment using “kubectl” CLI, run the following:
kubectl run msg-processor — image=aquamarine/dummylogs — replicas 3 msg-processor
To create the deployment using the web UI: switch back to “default” namespace, select “deployments”, and click “create” in the top right corner.
Complete the following information:
App name: msg-processor
Container image: aquamarine/dummylogs
Number of pods: 3
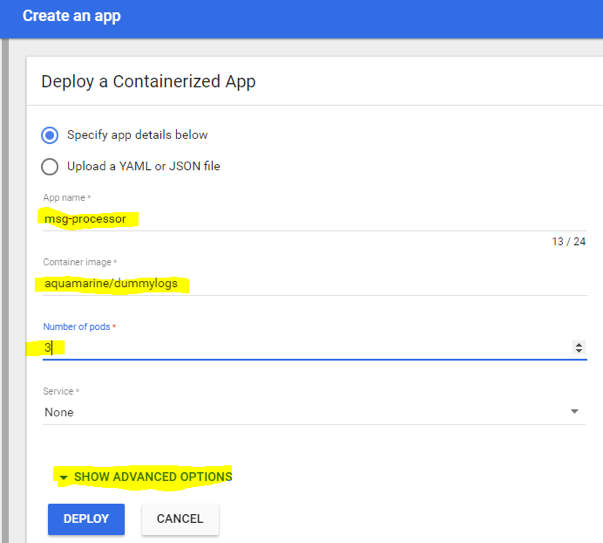
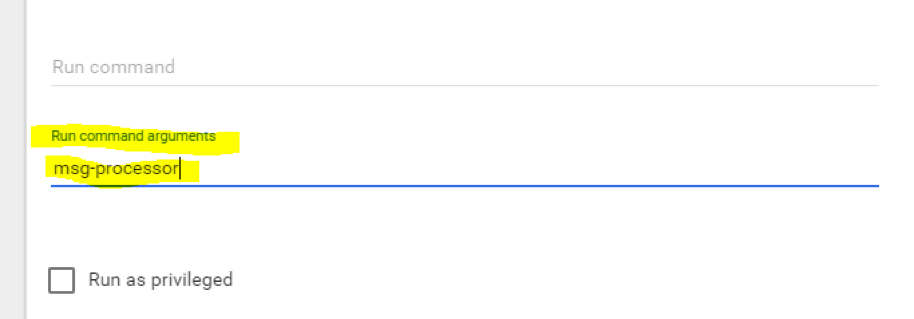
Select “Show advanced options”, and set an argument for the container to indicate its behavior: as a demo “message processor” service or something else (its log messages depend on that argument we set):
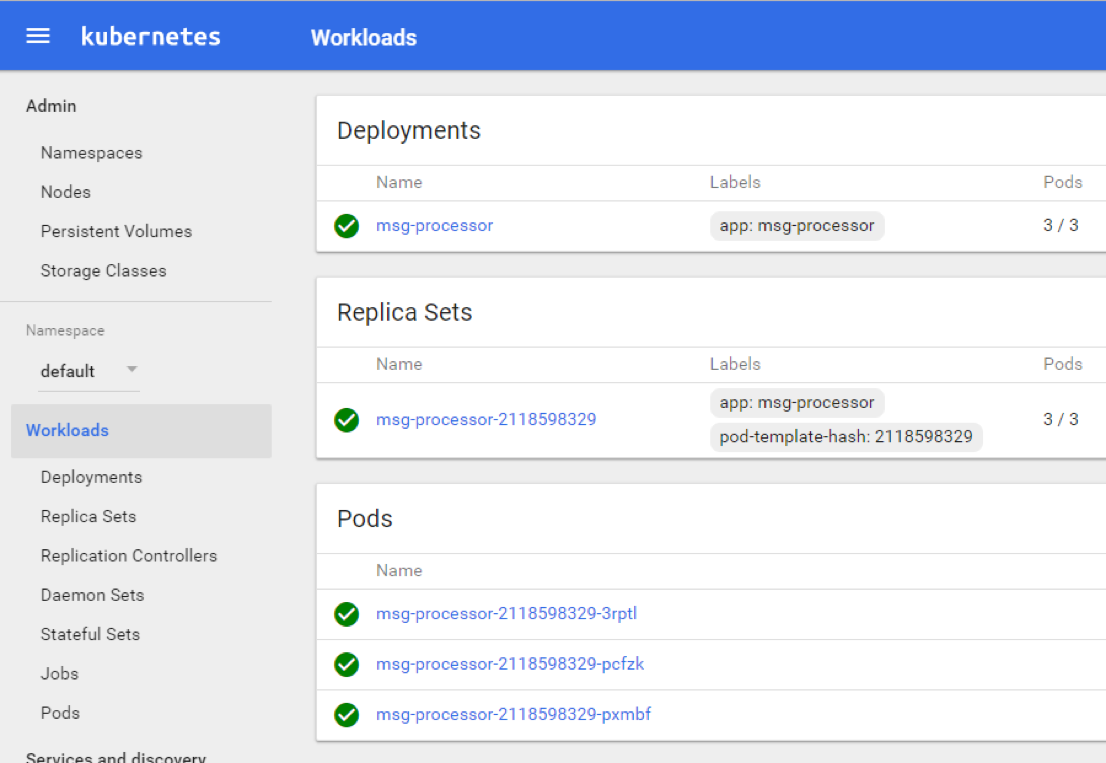
Click “Deploy” and allow the containers to start. Refresh the page after 10–15 seconds to see the services started:
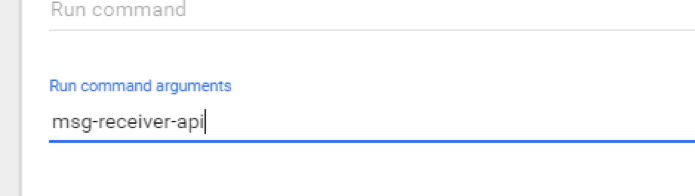
Using the same method, deploy the next dummy service, “msg-receiver-api”. To create it using “kubectl” CLI, run the following:
kubectl run msg-receiver-api --image=aquamarine/dummylogs --replicas 3 msg-receiver-api
To create using the web UI, repeat all steps, using “msg-receiver-api” as both the “App name” and as the “argument” in advanced settings:
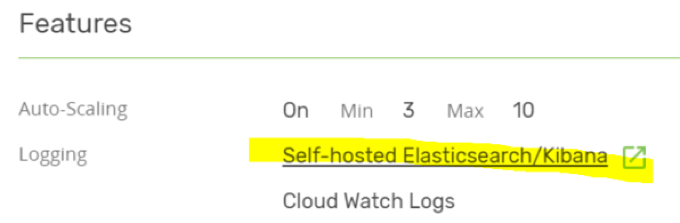
Deploy and wait for the green signs. When we have all those running, our Elasticsearch will start filling up with demo messages of various log level and meaning. Let’s look at this in Kibana. If you deployed the Kubernetes cluster using Kublr, navigate back to the Kublr dashboard, select the “Overview” tab, and click the following link:
You should see the Kibana dashboard. If this is your first time opening the dashboard, the “create index pattern” page is displayed. This page is used to select which Elasticsearch indexes we want to explore and visualize with Kibana.
The current “logstash-*” pattern is exactly what we need, so click “Create”. Proceed to the “Discover” section:
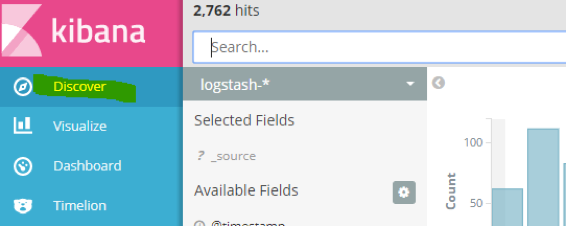
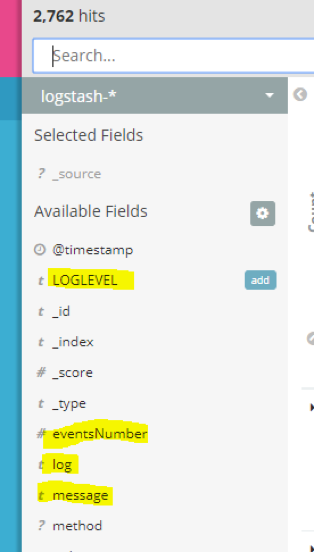
Note the fields in the sidebar. “Log” is the content of each container stdout or stderr stream, and our extracted fields from the “log” are also here (“LOGLEVEL”, “eventsNumber”, etc):
Locate and click the “serviceName” to see which services we extracted messages from:
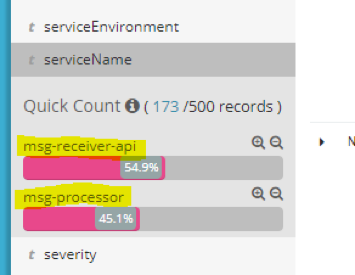
We can see that our dummy logs from “msg-processor” and “mgs-receiver-api” were received and, in the previous 15 minutes, the “api” service logged more messages. To filter by this term and see only one service message, click the “plus” sign. A search will begin for that service log, and you will see that all messages shown are from “msg-processor”:

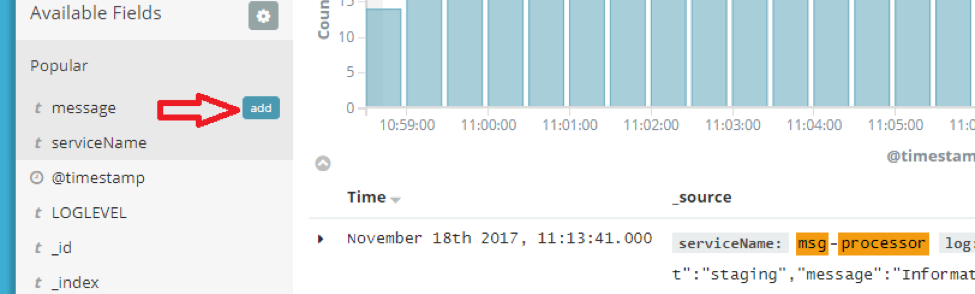
But what if we want to easily browse just last “message” fields? You can add a field to “Selected fields” in Kibana so it will show only that field content. Click “add” to the right of the “message” field to see only that field:
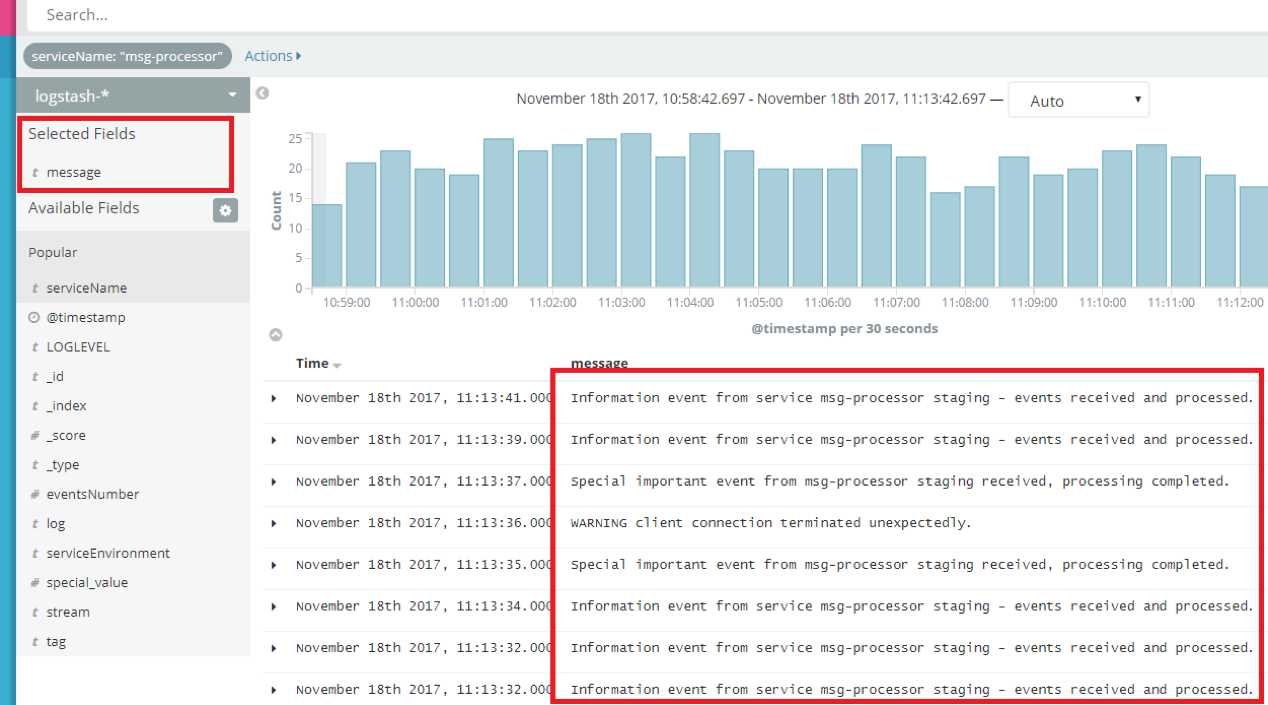
You can see how much easier it is now to look for the needed message. Note how the field name was added under the “Selected fields” header in the sidebar. You can add or remove more fields to edit the current view. The messages now are clear, and we can see the recent events easily:
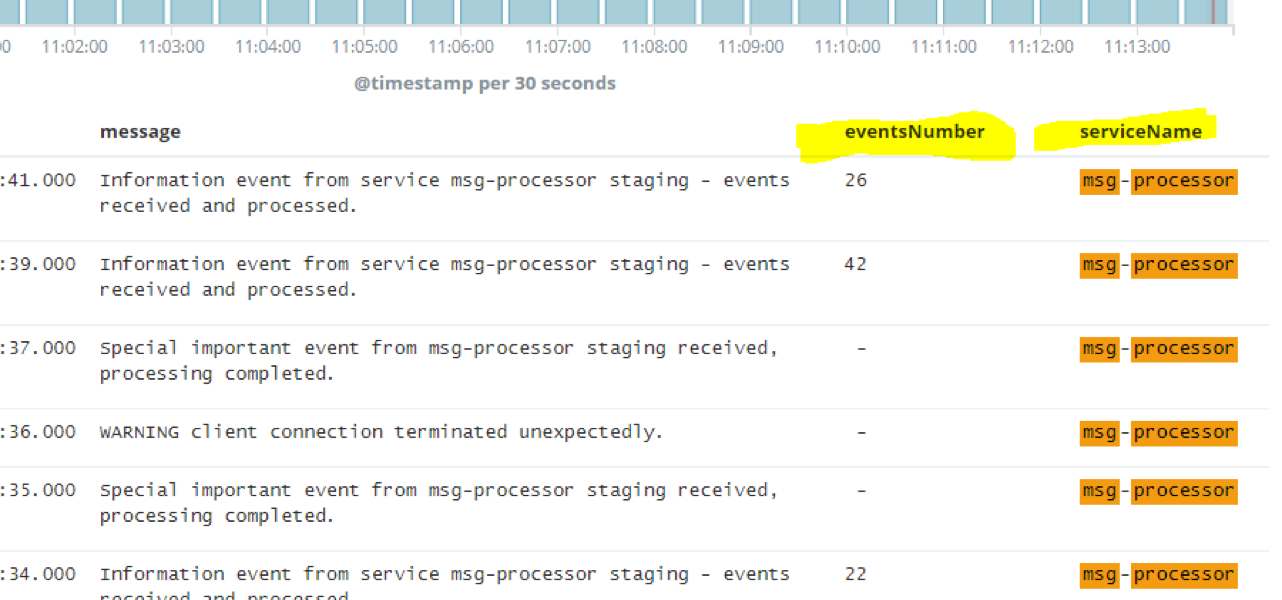
You can expand any message and see all other related fields in the message (for example, how many events were actually received). To make this correlation easier, we can also add the “eventsNumber” to selected fields. Click “add” on both “eventsNumber” and “serviceName” and your view will now display these:
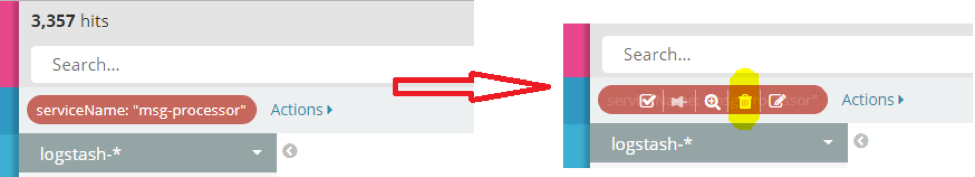
The “msg-processor” is still highlighted because we have the “term” filter applied. You can either use free search in the “search” input at the top or click “+” and “-” in quick view to add and remove fields from search. If we want to see messages of both services, we need to add the second service name to the search. Clear the search by clicking delete on the term under the search bar:
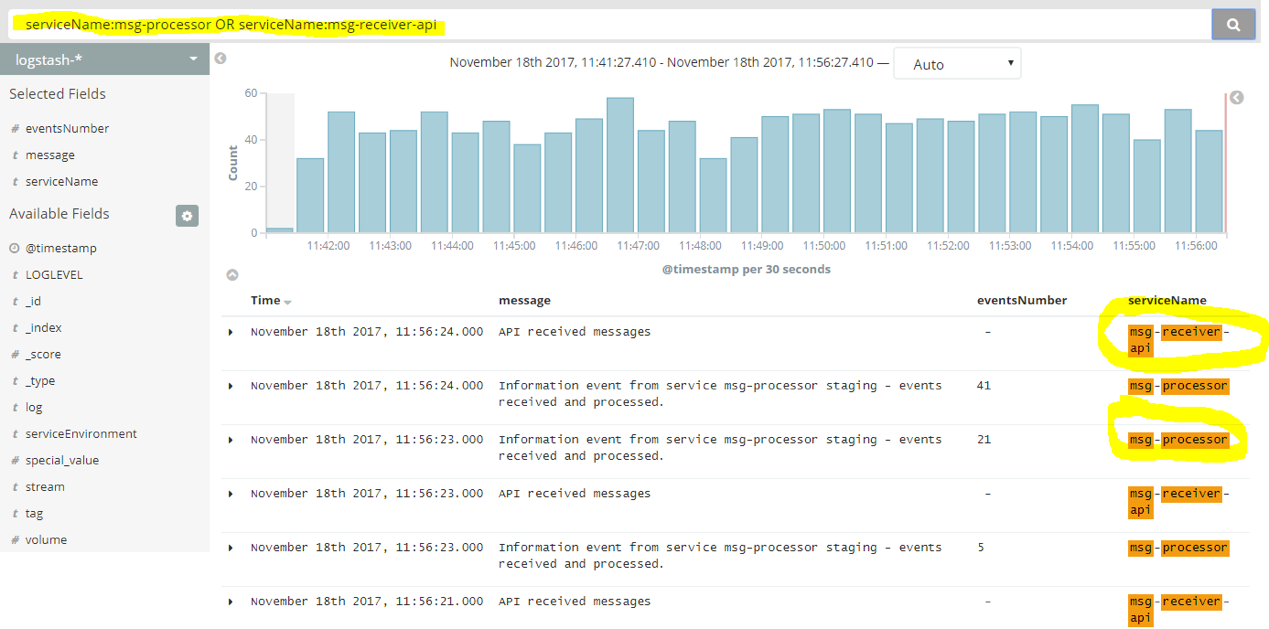
Paste the following simple query into the search input:
serviceName:msg-processor OR serviceName:msg-receiver-api
This will search for both names to filter, and we will see messages from both “msg-processor” and “msg-receiver-api”:
Now it’s time to build a graph to depict how many events are processed by the “mgs-processor” pods.
Navigate to “Visualize”, and select “Create a visualization”. Select “Area” to build a filled line graph, and select the “logstash-*” index when presented with index selection.
You will see the “new visualization” builder page. Here is the needed configuration for our graph:
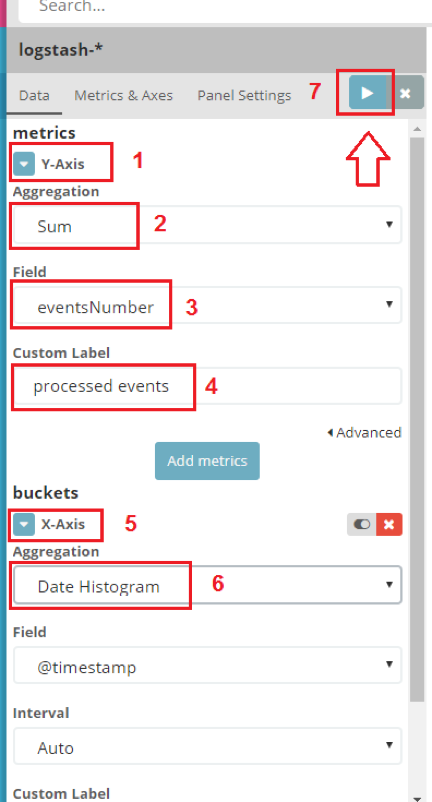
- Press “Y-axis” to expand its settings.
- Select “sum” aggregation to summarize the numeric values of any chosen field.
- Select “eventsNumber” field to display on the graph the number of events processed at any given time.
- Finally, assign a label of your choice.
- Proceed to setting the “X-axis”. Under “buckets” you will see the fields that we can configure.
- Select the aggregation selection “Date histogram”; this is the most common use case for displaying the chronological order of some events.
The field entry “@timestamp” will be selected automatically. The “interval” field specifies the “step size” on the “X” axis. The interval can be minutes, hours, etc. We will use “auto” mode, which means it will adjust step size based on your timeframe selection (the timeframe on top, “last 15 minutes”, etc’).
- Select the “apply” button.
You will see a graph similar to the following:
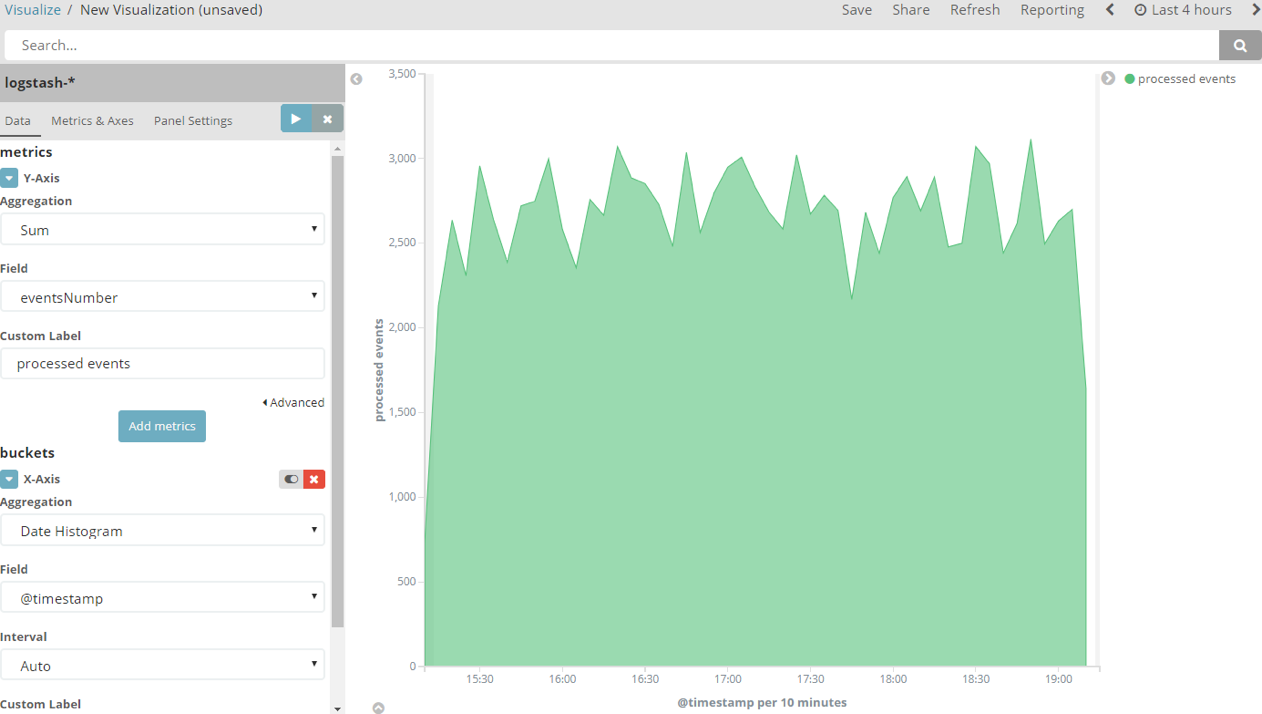
I chose to display the last 4 hours because it was running for some time. If you select 15 or 30 minutes, your numbers will be in the 250–300 range. These numbers represent the number of processed messages. (No real messages were processed. Our dummy logger just logs these notifications and a few random errors that we will investigate in the next steps).
We could correlate the volume of “msg-receiver-api” events with the total processed messages from the “msg-processor” service. To add a second layer to this graph, add a new metric on “Y-axis”. Select “Add metrics” and “Y-axis”.
- Select aggregation “sum”.
- Select field “volume”.
- Enter “API calls” to indicate API calls volume received by “msg-receiver-api”.
- Select “apply” again to refresh the graph.
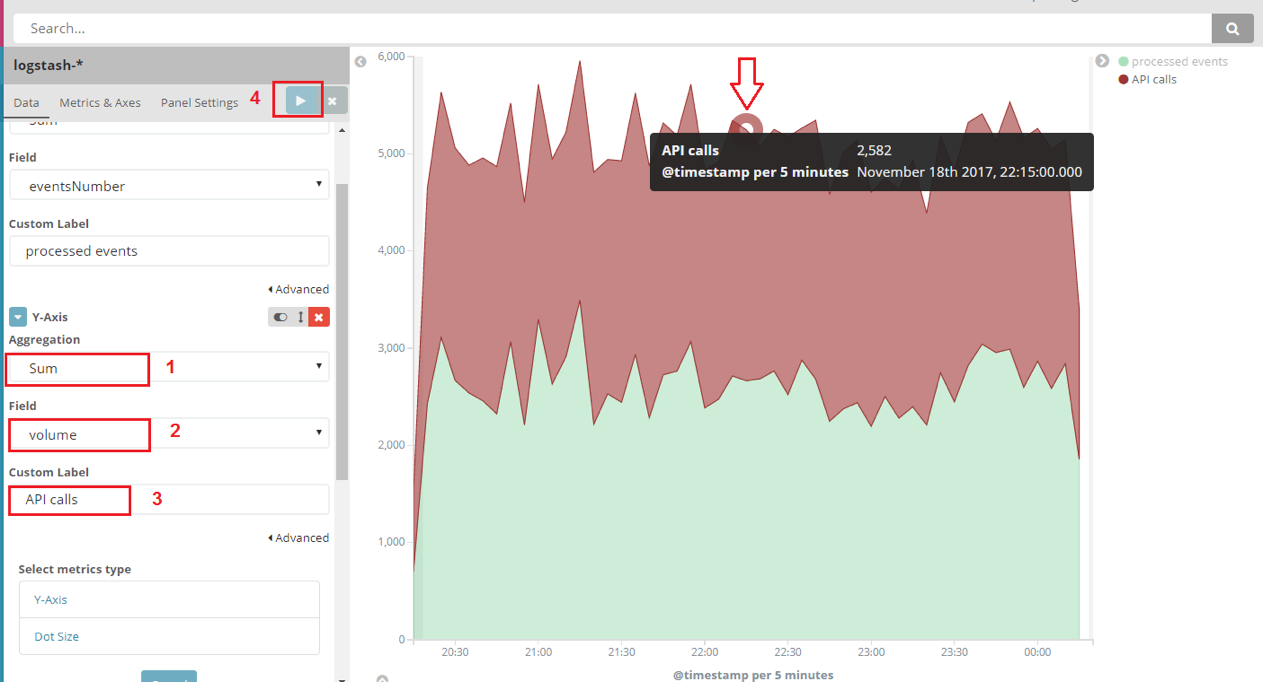
Now you have both service events displayed.
You’ve learned how to add more data to a graph and how to correlate between different metrics (collected by means of logging).
Usually, an application will send metrics separately from logs to a time-series database like InfluxDB or a service like Prometheus. However, using this example you’ve learned how to aggregate, count or average any numeric values from your logs, and visualize them. Save this graph by clicking “save” on top, and give it a name such as “API events and processed messages”.
But what if we are getting errors or warnings in our logs from one or more services, or we’re getting just a few errors that we still find critical to troubleshoot because they were unexpected? How can we find out which errors might be related to each other?
Let’s go back to the “Discover” page, and select all errors and warnings in the last 30 minutes. Execute a search of “LOGLEVEL:ERROR OR LOGLEVEL:WARNING”.
You will see that we have quite a few errors and warnings:

We actually have only 4 errors thrown every 15–20 minutes; the remaining items are warnings. (You will have more or fewer errors depending on how many pods of each demo service you started.)
We may want to drill down to correlate between errors and determine if they’re related to each other. We might also encounter a scenario with thousands of messages and more than two services. To visualize these scenarios, we need to place information on a graph to see if those errors might be related.
Go to “Visualize”, create a new visualization, select “Vertical bar”, and click on “logstash-*” index. We will want to have each service represented by a different color. To configure this basic step, follow the steps highlighted in this screenshot:
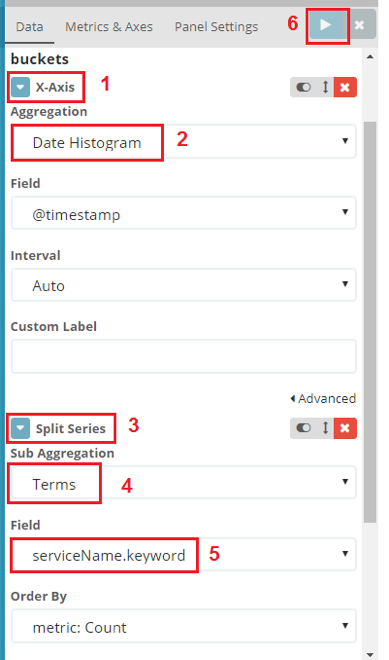
Ignore the “Y-axis”. This axis will use the default “Count” setting, which just shows a count of messages. We need just a count because we don’t have to summarize or average anything at this time (just count the text messages), and we do not need to operate on numeric values found in those messages.
- Click “X-axis” under buckets.
- Select “Date histogram” as we’re looking for a time match between some errors or warnings in our services.
- Click “Add sub-buckets” and select “Split series”. This will allow us to separate bars by a filter on a specific field (for example, by the unique value of “serviceName” field). Each variation will become another “layer” of our graph. Note that if you choose “Split charts” the effect will be similar, but we’ll see several separate charts (one for each service), and it will become messy if we have more than two or three services. “Split series” allows us to display different colors on the same chart instead.
- Select “Terms” as the sub-aggregation.
- Chose the “serviceName.keyword” field.
- Select “apply”.
Our graph now shows each service message in a different color:
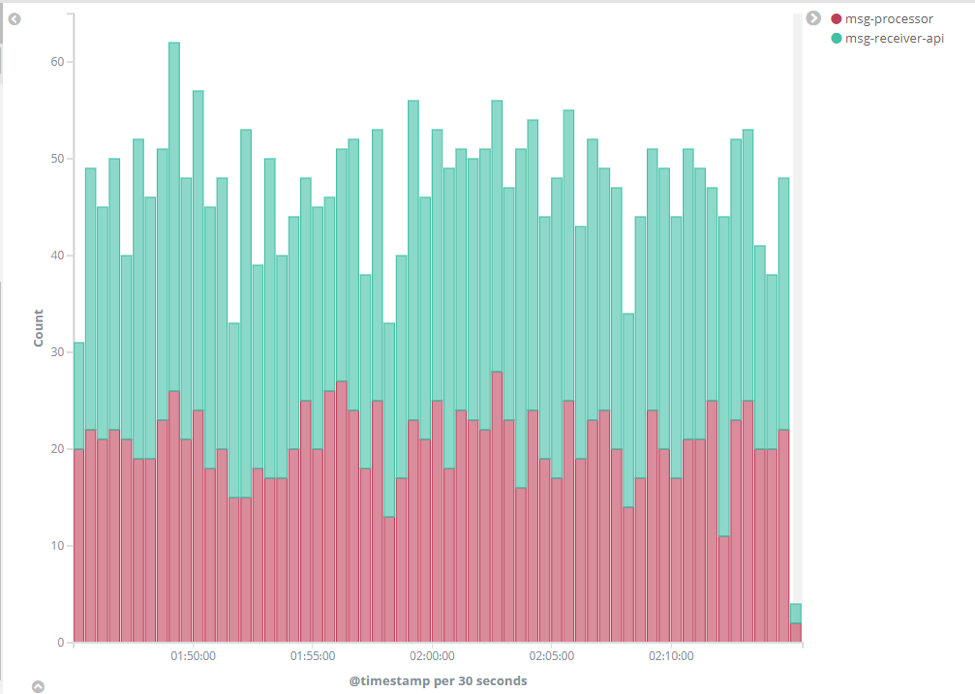
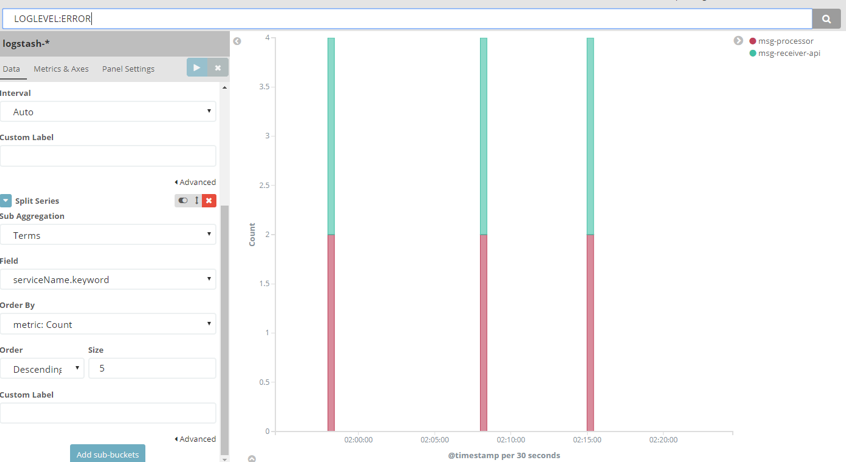
Next, we’ll specify what we’re looking for in the search input, because what we see is a count of all messages from each service, including both normal logs and errors. To filter only warnings and errors, enter “LOGLEVEL:ERROR OR LOGLEVEL:WARNING” for search, and click enter:
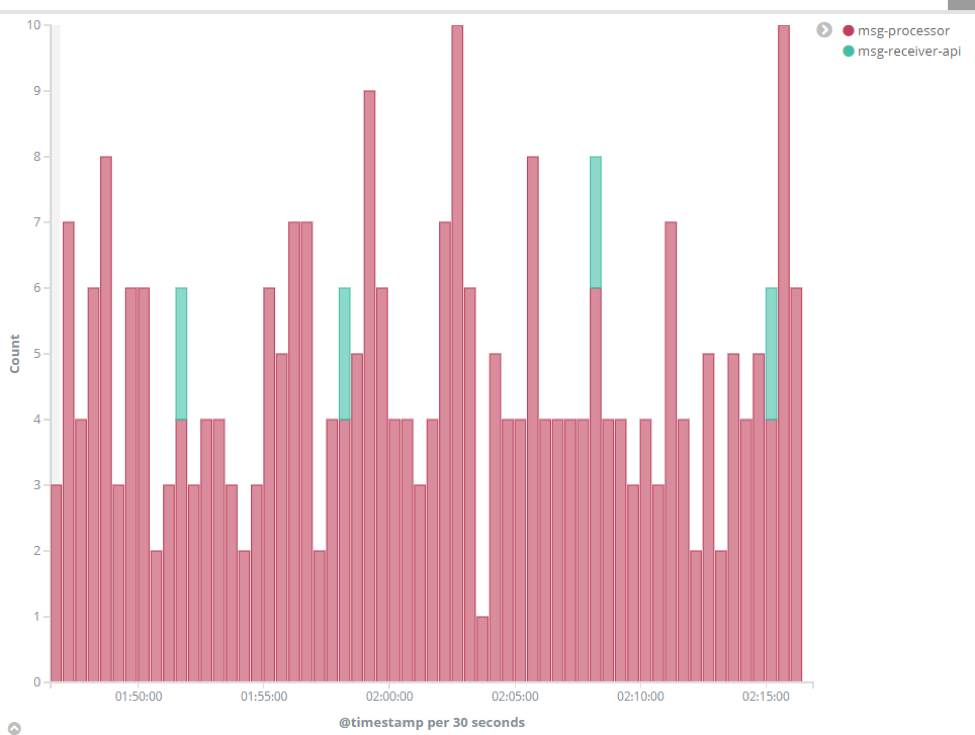
We can see that the “msg-processor” service has many issues, while only a few are coming from the green “msg-receiver-api”. To display more useful data, we can try to remove the warnings that over-saturate the chart. Use a search string of “LOGLEVEL:ERROR” only and click enter. Every error of “msg-processor” seems to be directly related to an error of “msg-receiver-api” during approximately the same time:
We can save the chart in order to later add it to a “dashboard”, which can combine many “visualizations” on the same page. Select “save”, and enter the name “Service errors”.
By viewing the messages on the “Discover” page (using “LOGLEVEL:ERROR” search), we can examine the text of each message and understand what’s going on:
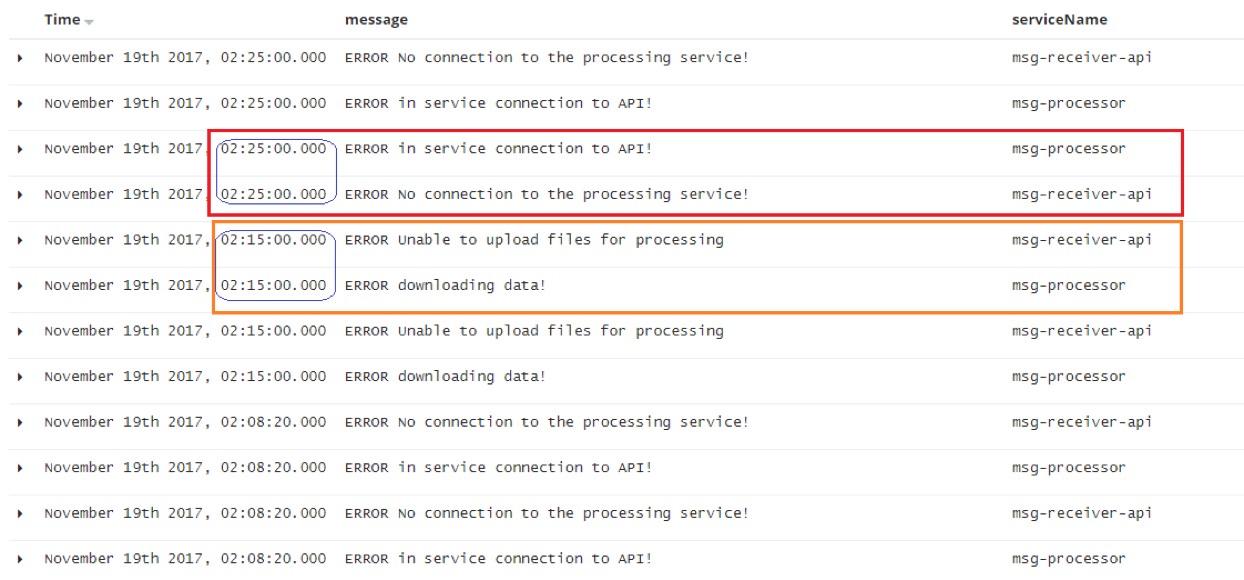
When the “msg-processor” logs an “ERROR in service connection to API!” message, a connection issue is logged in “mgs-receiver-api” at the same time. And when “msg-receiver-api” logs “ERROR unable to upload files for processing”, we also get the “ERROR downloading data!” on the “msg-processor” side. We easily found this issue by filtering through hundreds of info and warning level messages.
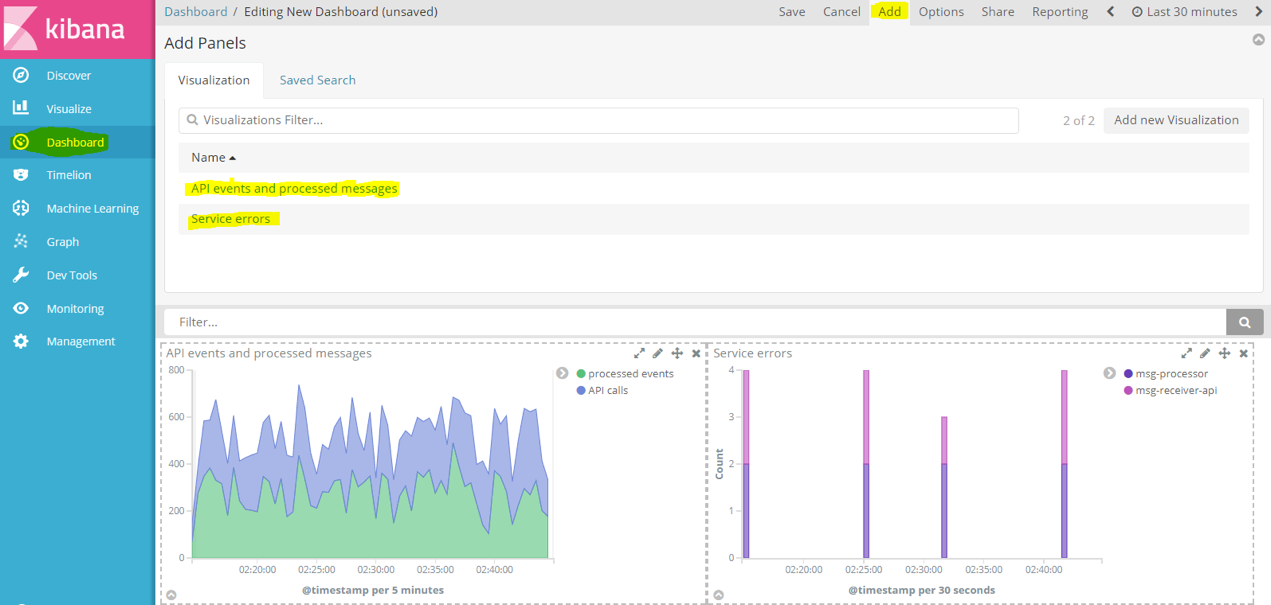
You can create more visualizations with the data logged by our dummy loggers, and place these in a dashboard. To create a simple dashboard with our current two visualizations, navigate to “Dashboard”. Click create new, and click “Add” at the top to view our list of available visualizations that we saved earlier. Select each of them to add to the dashboard, click “save”, and assign a name like “Events and Errors” to this dashboard.
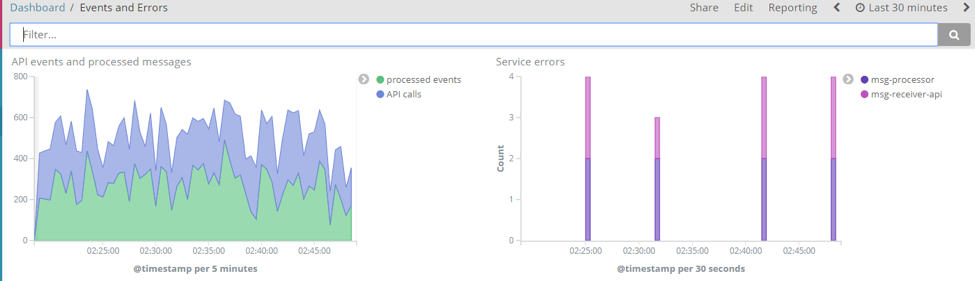
The final dashboard should look similar to this:
We see the previous 30 minutes, but did we have a lot of activity in the last 24 hours? If your pods were running for a few days, you might see something like this:
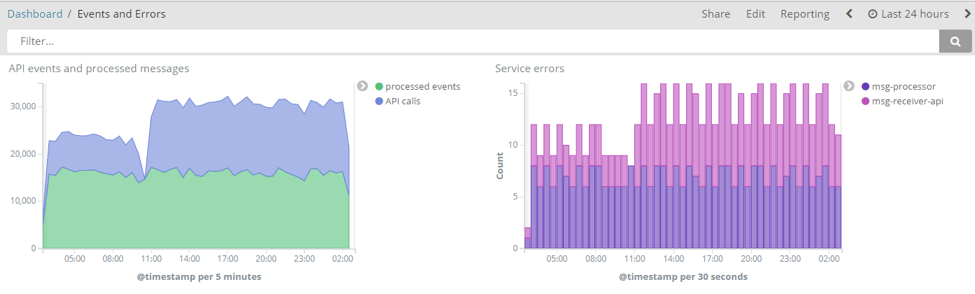
We can see that many events were processed and errors logged. To avoid having so many errors in production, consider adding ElastAlert to your setup and configuring alerting based on terms like the “LOGLEVEL” we used in this tutorial.
We didn’t explore the second option for storing and analyzing log data, which is CloudWatch, but if you host your Kubernetes cluster on AWS, this might be a good option also.